This sample demonstrates how to consume Mistral’s streaming chat completion endpoint using HttpClient and Server-Sent Events (SSE). The implementation streams tokens to the console as they arrive, supports cancellation with Ctrl+C, and captures token usage information. A CancellationTokenSource is used to support user-initiated cancellation. Pressing Ctrl+C cancels the active request without terminating the application, allowing the user to continue interacting with the chat client.
Rather than waiting for the complete response, the request is sent with Stream = true and the response is processed as an SSE stream. This provides a significantly better user experience because generated tokens are displayed as soon as they are received. Each chunk contains a delta payload that may include newly generated content.
// Ctrl+C cancels the current request and returns to the prompt; second Ctrl+C exits the process.
using var cts = new CancellationTokenSource();
Console.CancelKeyPress += (_, e) =>
{
if (!cts.IsCancellationRequested)
{
e.Cancel = true;
cts.Cancel();
}
};
while (!cts.IsCancellationRequested)
{
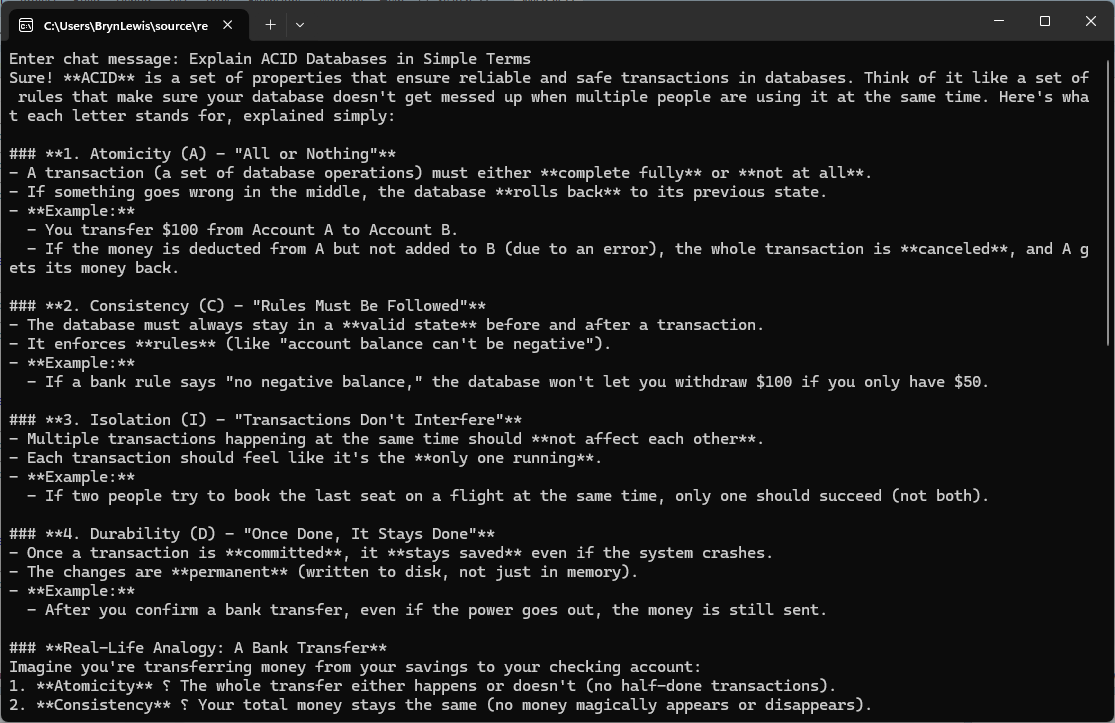
Console.Write("Enter chat message: ");
var content = Console.ReadLine();
if (string.IsNullOrWhiteSpace(content)) break;
var request = new ChatStreamingCompletionRequest
{
Model = settings.ModelName,
Messages =
[
new ChatMessage { Role = "user", Content = content }
],
Stream = true,
};
try
{
using var httpRequest = new HttpRequestMessage(HttpMethod.Post, "chat/completions")
{
Content = JsonContent.Create(request, options: jsonSerializerOptions)
};
using var httpResponse = await httpClient.SendAsync(httpRequest, HttpCompletionOption.ResponseHeadersRead, cts.Token);
if (!httpResponse.IsSuccessStatusCode)
{
var body = await httpResponse.Content.ReadAsStringAsync(cts.Token);
throw new HttpRequestException($"Mistral API {(int)httpResponse.StatusCode}: {body}", null, httpResponse.StatusCode);
}
await using var stream = await httpResponse.Content.ReadAsStreamAsync(cts.Token);
using var reader = new StreamReader(stream);
TokenUsage? finalUsage = null;
string? finishReason = null;
string? line;
// Mistral emits single-line `data:` chunks, so per-line dispatch is sufficient (no multi-line SSE concatenation required).
while ((line = await reader.ReadLineAsync(cts.Token)) is not null)
{
// SSE framing: blank line separates events, lines without "data:" are ignored (e.g. ":" keep-alive comments, "event:" / "id:" / "retry:" fields).
if (string.IsNullOrEmpty(line)) continue;
if (!line.StartsWith("data:", StringComparison.Ordinal)) continue;
var payload = line.AsSpan(5).TrimStart();
if (payload.SequenceEqual("[DONE]")) break;
var chunk = JsonSerializer.Deserialize<ChatCompletionChunk>(payload, jsonSerializerOptions);
if (chunk is null) continue;
foreach (var choice in chunk.Choices)
{
if (!string.IsNullOrEmpty(choice.Delta.Content))
{
Console.Write(choice.Delta.Content);
}
if (choice.FinishReason is not null)
{
finishReason = choice.FinishReason;
}
}
if (chunk.Usage is not null)
{
finalUsage = chunk.Usage;
}
}
Console.WriteLine();
Console.WriteLine();
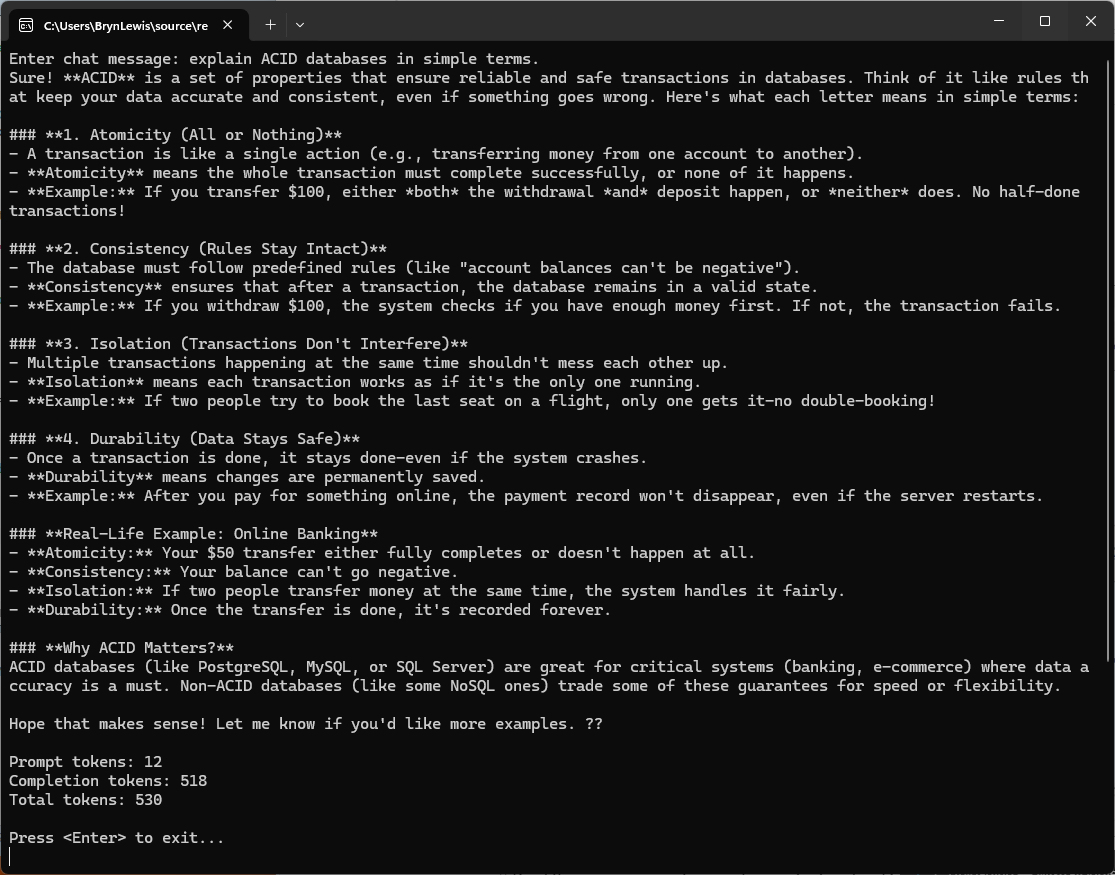
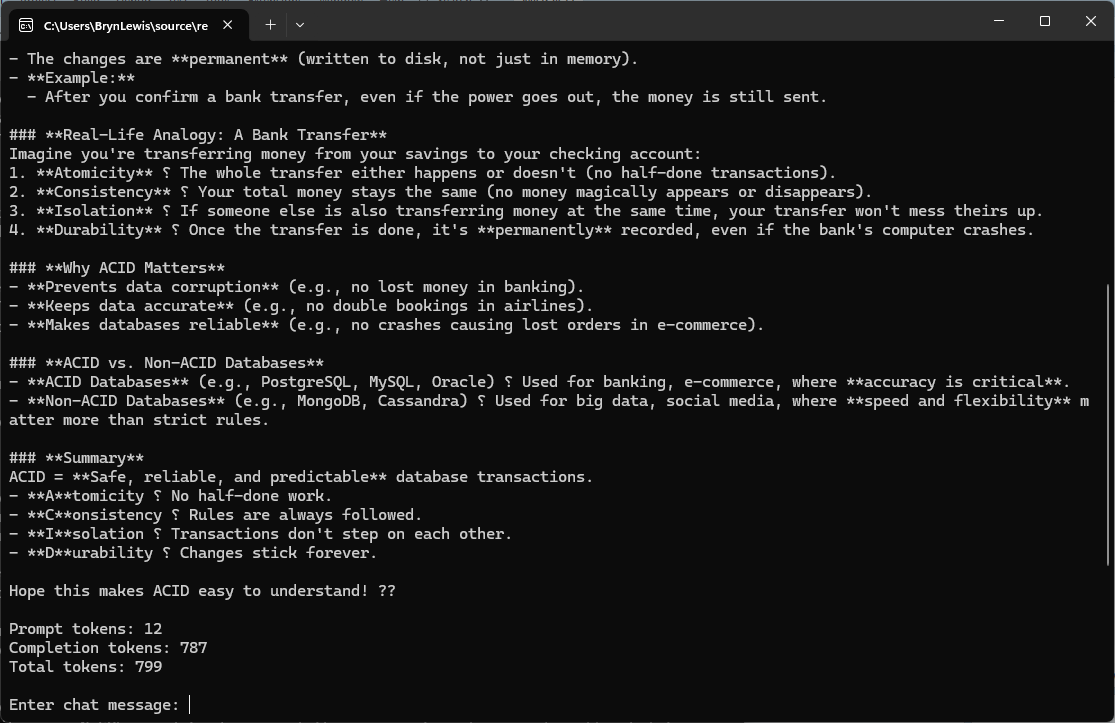
if (finalUsage is not null)
{
Console.WriteLine($"Prompt tokens: {finalUsage.PromptTokens}");
Console.WriteLine($"Completion tokens: {finalUsage.CompletionTokens}");
Console.WriteLine($"Total tokens: {finalUsage.TotalTokens}");
}
if (finishReason is not null)
{
Console.WriteLine($"Finish reason: {finishReason}");
}
Console.WriteLine();
}
catch (OperationCanceledException) when (cts.IsCancellationRequested)
{
Console.WriteLine();
Console.WriteLine("Request cancelled.");
// Reset the CTS so the next prompt iteration is cancellable again.
cts.TryReset();
}
catch (HttpRequestException ex)
{
Console.WriteLine($"Request failed: {(int?)ex.StatusCode ?? 0} {ex.Message}");
}
catch (TaskCanceledException)
{
Console.WriteLine("Request timed out.");
}
catch (JsonException ex)
{
Console.WriteLine($"Failed to parse response: {ex.Message}");
}
catch (IOException ex)
{
Console.WriteLine($"Stream error: {ex.Message}");
}
catch (Exception ex)
{
Console.WriteLine($"Unexpected error: {ex.GetType().Name}: {ex.Message}");
}
}
Uses HttpCompletionOption.ResponseHeadersRead to begin processing data as soon as headers are received.
public sealed class ChatStreamingCompletionRequest
{
   [JsonPropertyName("model")] public required string Model { get; init; }
   [JsonPropertyName("messages")] public required List<ChatMessage> Messages { get; init; }
   [JsonPropertyName("temperature")] public double? Temperature { get; init; }
   [JsonPropertyName("max_tokens")] public int? MaxTokens { get; init; }
   [JsonPropertyName("stream")] public bool? Stream { get; init; }
   [JsonPropertyName("response_format")] public ResponseFormat? ResponseFormat { get; init; }
}

public sealed class ChatMessage
{
   [JsonPropertyName("role")] public required string Role { get; init; }
   [JsonPropertyName("content")] public required string Content { get; init; }
}

public sealed class ResponseFormat
{
   [JsonPropertyName("type")] public required string Type { get; init; }
}

public sealed class ChatCompletionChunk
{
   [JsonPropertyName("id")] public required string Id { get; init; }
   [JsonPropertyName("choices")] public required List<ChatCompletionDelta> Choices { get; init; }
   [JsonPropertyName("usage")] public TokenUsage? Usage { get; init; }
}

public sealed class ChatCompletionDelta
{
   [JsonPropertyName("index")] public int Index { get; init; }
   [JsonPropertyName("delta")] public required ChatMessageDelta Delta { get; init; }
   [JsonPropertyName("finish_reason")] public string? FinishReason { get; init; }
}

public sealed class ChatMessageDelta
{
   [JsonPropertyName("role")] public string? Role { get; init; }
   [JsonPropertyName("content")] public string? Content { get; init; }
}

public sealed class TokenUsage
{
   [JsonPropertyName("prompt_tokens")] public int? PromptTokens { get; init; }
   [JsonPropertyName("completion_tokens")] public int? CompletionTokens { get; init; }
   [JsonPropertyName("total_tokens")] public int? TotalTokens { get; init; }
}
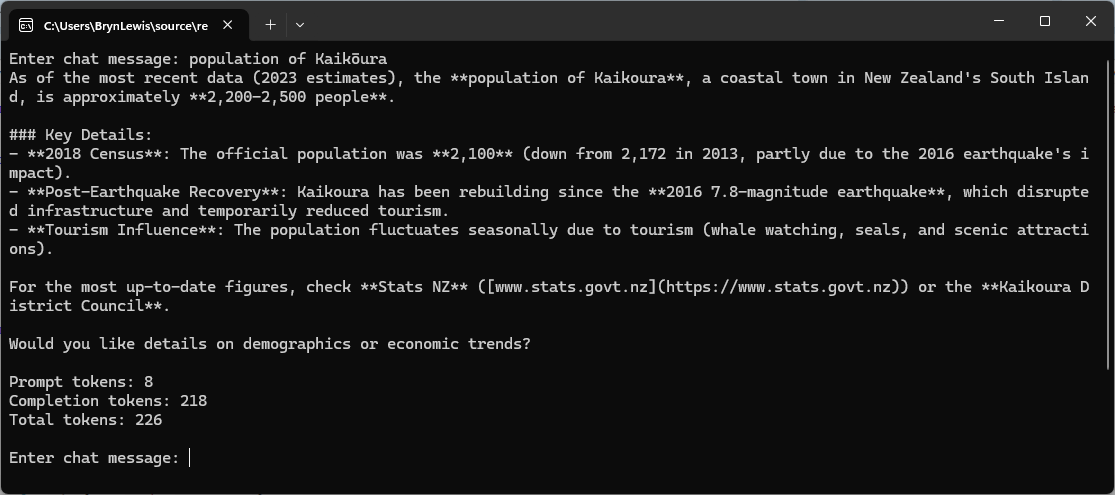
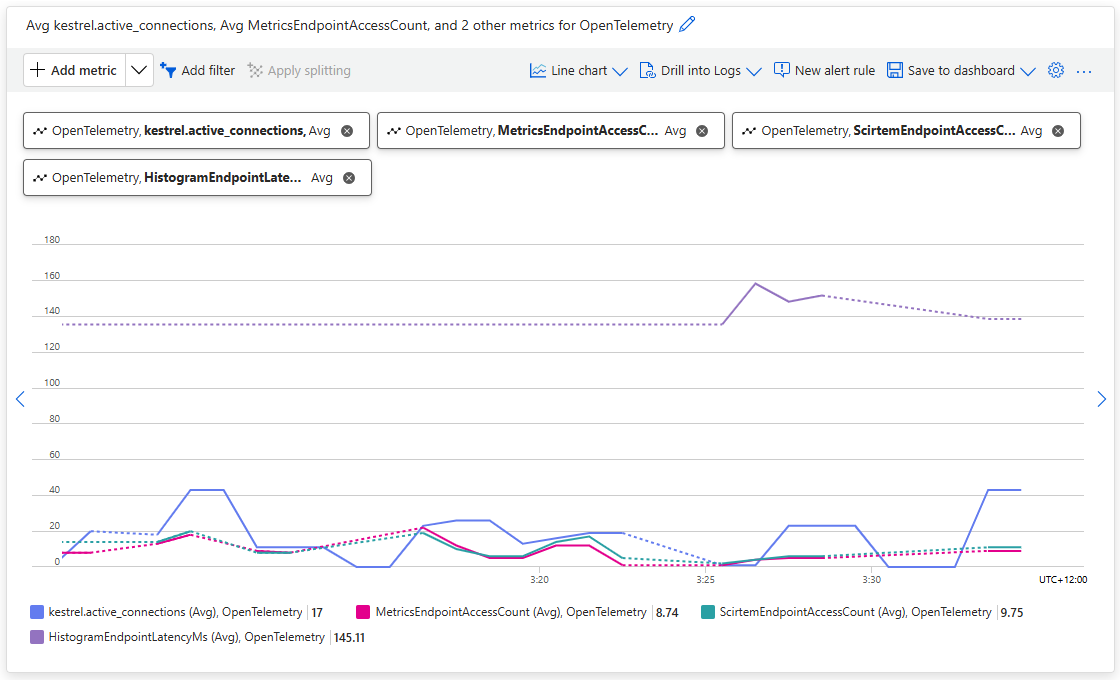
When available, token usage statistics are captured from the final response chunk and displayed after generation completes.
Figured I might as well get Anthropic’s Claude to review my code.
Code Review: MistralBasicStreamingCLI
Scope: files in MistralBasicStreamingCLI/ only (Program.cs, Model.cs, ApplicationSettings.cs, appsettings.json, .csproj).
Summary
Small, single-file-ish PoC CLI that streams Mistral chat completions over SSE. Overall solid for its stated purpose (the file header calls it “horrible” — it’s actually reasonably clean). Config/secrets handling, cancellation plumbing, and exception granularity are all good practice. Findings below are ranked roughly by severity.
Findings
1. Ctrl+C behavior contradicts its own comment (Medium)
Program.cs:43 says:
> Ctrl+C cancels the current request and returns to the prompt; second Ctrl+C exits the process.
That holds only if Ctrl+C is pressed while a request is in flight — in that case the catch (OperationCanceledException) block runs and calls cts.TryReset() (line 141), so the loop continues.
But if Ctrl+C is pressed while sitting at the Console.ReadLine() prompt (before any request is sent), cts.Cancel() fires, Console.ReadLine() returns (typically null), and content fails the IsNullOrWhiteSpace check on line 58, so the loop hits break directly — no TryReset() call, no “second Ctrl+C” needed. The program exits on the first Ctrl+C in this case.
Net effect: whether Ctrl+C exits immediately or returns you to the prompt depends on exact timing (mid-request vs. at-prompt), which will look like inconsistent/buggy behavior to a user. If the two-stage cancel is intended everywhere, the prompt-read would need to be cancellable too (e.g. via a Task.Run wrapping Console.ReadLine() racing the token, or Console.KeyAvailable polling).
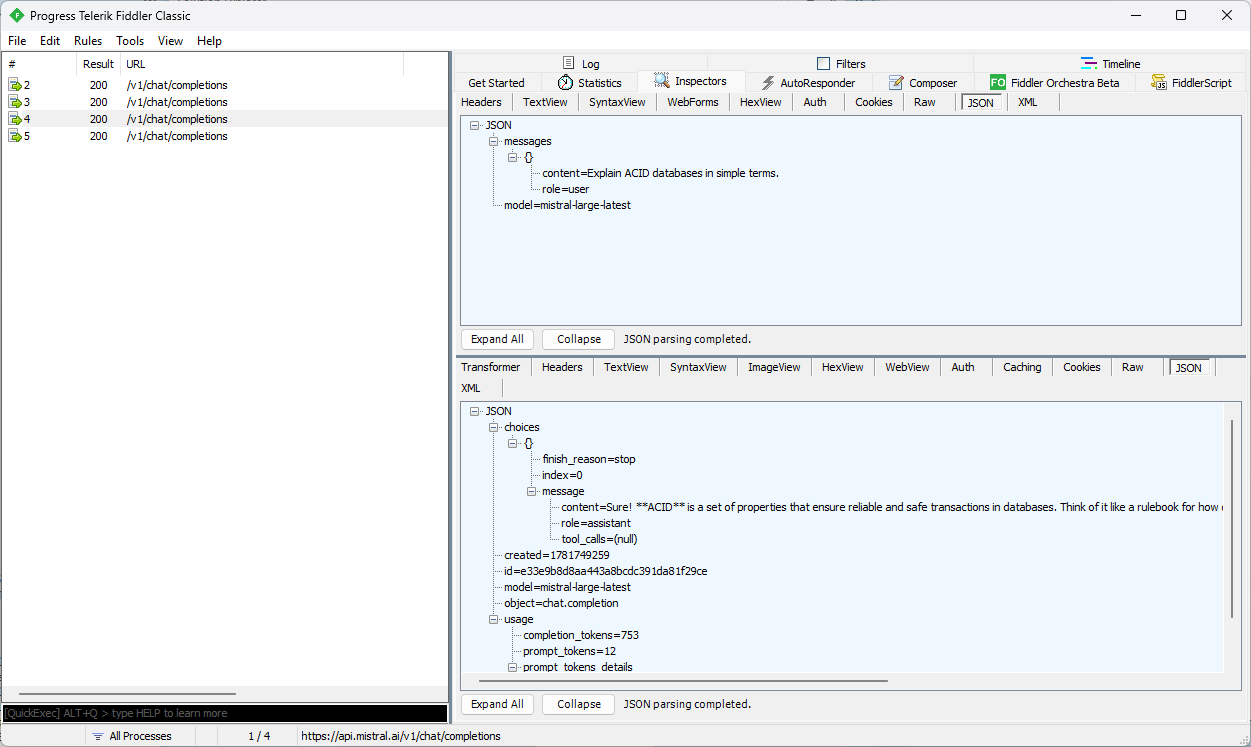
2. Streaming Usage block may never populate (Worth verifying)
Program.cs:116-119 and 126-128 only print token counts if chunk.Usage is not null. For OpenAI-compatible streaming APIs, the final chunk generally only carries usage when the request explicitly opts in (OpenAI requires "stream_options": {"include_usage": true}). ChatStreamingCompletionRequest (Model.cs:5-13) has no StreamOptions/equivalent property, and the request never sends one.
If Mistral’s API follows the same opt-in convention, finalUsage will always stay null and the “Prompt tokens / Completion tokens / Total tokens” lines will silently never print. If Mistral always includes usage on the last chunk regardless (some of their docs suggest this), then it’s fine as-is. Worth a quick manual test against the real API to confirm which is true — if it’s the former, add a stream_options field to the request model.
3. Redundant double-dispose of the response stream (Low)
await using var stream = await httpResponse.Content.ReadAsStreamAsync(cts.Token);
using var reader = new StreamReader(stream);
reader’s (synchronous) Dispose() runs first at scope exit and disposes the underlying stream (default leaveOpen: false). The outer await using then calls DisposeAsync() on the same, already-disposed stream. This is harmless (Stream.Dispose/DisposeAsync are idempotent) but is dead code — either drop await using in favor of a plain using, or construct StreamReader with leaveOpen: true and let the outer await using be the one real disposal.
4. No conversation history — every turn is stateless (Design note)
Each loop iteration sends a single ChatMessage { Role = "user", Content = content } (Program.cs:60-68) with no prior turns or system prompt included. So the “chat loop” is really a sequence of independent one-shot completions, not a multi-turn conversation. Likely intentional for a minimal PoC, but worth calling out in case a real chat history was expected.
5. Unused request fields (Low / cosmetic)
Temperature, MaxTokens, and ResponseFormat on ChatStreamingCompletionRequest (Model.cs:9,10,12) are never set anywhere — every request sends null for all three (and they’re omitted from the JSON payload thanks to WhenWritingNull). Not a bug, just currently-dead surface area on the model; fine to leave if they’re there for future use, otherwise consider trimming until needed.
6. appsettings.json ships an empty ApiKey (Informational, not a defect)
appsettings.json:3 has "ApiKey": "", with the real key presumably supplied via dotnet user-secrets (UserSecretsId is wired up in the .csproj). This is the correct pattern — flagging only so it stays that way and nobody “temporarily” pastes a real key into this file for a quick test and commits it.
Positives worth keeping
- Secrets handling:
AddUserSecrets()+ empty placeholder inappsettings.jsonis the right pattern for a local PoC. - Startup validation:
ArgumentException.ThrowIfNullOrWhiteSpaceon required settings fails fast with a clear message instead of a confusing null-ref later. HttpClient.Timeout = Timeout.InfiniteTimeSpanpaired with aCancellationTokenis the correct way to handle long-lived SSE connections — avoids the common bug of a wall-clock timeout killing a slow-but-healthy stream.BaseAddress/relative-URI combination (https://api.mistral.ai/v1/+chat/completions) is done correctly (trailing slash on base, no leading slash on relative) — a very common source of bugs elsewhere.- SSE line parsing correctly ignores blank lines and non-
data:fields (comments,event:,id:,retry:), and checks for[DONE]before attempting to parse JSON. - Exception granularity: catching
OperationCanceledException,HttpRequestException,TaskCanceledException,JsonException,IOExceptionseparately before a generic fallback gives useful, distinct messages per failure mode rather than one catch-all.
Suggested priority
- Decide/fix the Ctrl+C-at-prompt vs. Ctrl+C-mid-request inconsistency (#1) if consistent behavior matters for this PoC’s usability.
- Confirm whether
Usageactually arrives from Mistral’s streaming endpoint withoutstream_options(#2) — quick manual test settles it. - Everything else is cosmetic/cleanup, safe to defer.
Using strongly typed request and response Data Transfer Objects(DTOs) improved maintainability but without manual “tweaking” a request/response could fail.(esp. required & nullable). This implementation assumes that the Mistral Chat Completion API returns single-line JavaScript Object Notation(JSON) payloads in each SSE data: event, which simplified the parser implementation.