Over the last couple of months, I’ve been experimenting with a range of AI coding tools starting with GitHub Copilot, then Anthropic Claude, and more recently, Mistral (I was looking for an on-prem solution). Mistral is a French company so is covered by the General Data Protect Regulation(GDPR) rules of the European Union(EU) which is way better than the regulations the other providers have to comply with.
Like many .NET developers, I started with Copilot as a natural extension of my workflow, expecting it to streamline repetitive tasks and accelerate development. When I started using Building Edge AI with Github Copilot- Security Camera HTTP(Jan 2025) the experience wasn’t great. Especially when I was using it for the “niche” areas I work-in it was pretty hopeless (sometimes even referred me to my own blog posts).
After a while I started trialing the other tools in my workflow and though they were better, sometimes F2-Replace or intellisense were faster and used a lot less tokens. I would also get the different tools to review the code of the others. I especially liked the Claude “Irony stack” when using it review Co-Pilot generated code.
While the other tools certainly helped (especially after adding custom skills files), I often found myself spending as much time going “down rabbit holes”(not the tool’s problem, though I hopefully learnt some useful stuff) and correcting or restructuring or debugging generated code that I could have written faster from scratch.
That’s what made my “out of box” experience with Mistral stand out. With a relatively simple prompt, it produced code that was not only concise but surprisingly accurate with just a single compile time error and no warnings on the first pass.
NOTE: This was using the webby interface, but I now have a paid for subscription.
The instructions which included .NET 8 (bit retro) and “dotnet add package”(pretty good) meant the code compiled on second attempt. The issue was a syntax error initialising OpenTelemetry which was quickly fixed, somewhat ironically with GitHub Copilot.
.ConfigureResource(resourceBuilder) rather than .ConfigureResource(rb => rb = resourceBuilder)
//dotnet add package OpenTelemetry
//dotnet add package OpenTelemetry.Extensions.Hosting
//dotnet add package OpenTelemetry.Instrumentation.AspNetCore
//dotnet add package OpenTelemetry.Instrumentation.Http
//dotnet add package OpenTelemetry.Exporter.Console
//dotnet add package OpenTelemetry.Exporter.OpenTelemetryProtocol
//
//using OpenTelemetry;
using OpenTelemetry.Metrics;
using OpenTelemetry.Resources;
using OpenTelemetry.Trace;
using System.Diagnostics;

var builder = WebApplication.CreateBuilder(args);

// Configure OpenTelemetry with a resource (service name)
var resourceBuilder = ResourceBuilder.CreateDefault()
    .AddService(serviceName: builder.Environment.ApplicationName);

// Add OpenTelemetry Tracing
builder.Services.AddOpenTelemetry()
    //.ConfigureResource(resourceBuilder) /**** This was the only compile time issue
    .ConfigureResource(rb => rb = resourceBuilder)
    .WithTracing(tracerProviderBuilder =>
    {
       tracerProviderBuilder
           .AddSource("MinimalApiSample")
           .AddAspNetCoreInstrumentation(options =>
           {
              options.RecordException = true;
           })
           .AddHttpClientInstrumentation()
           .AddConsoleExporter(); // For demo: export to console
           //.AddOtlpExporter(); // Uncomment to export to OpenTelemetry Collector

    })
    .WithMetrics(metricsProviderBuilder =>
    {
       metricsProviderBuilder
           .AddAspNetCoreInstrumentation()
           .AddHttpClientInstrumentation()
           .AddConsoleExporter(); // For demo: export to console
           //.AddOtlpExporter(); // Uncomment to export to OpenTelemetry Collector
    });

var app = builder.Build();

// Example of a custom activity for tracing
var activitySource = new ActivitySource("MinimalApiSample");

app.MapGet("/", () =>
{
   using var activity = activitySource.StartActivity("RootEndpoint");
   activity?.SetTag("custom.tag", "Hello, OpenTelemetry!");
   return Results.Ok("Hello, OpenTelemetry!");
});

app.MapGet("/metrics", () =>
{
   // This endpoint is just for demo; metrics are exported automatically
   return Results.Ok("Metrics are being collected in the background.");
});

app.Run();
//dotnet add package OpenTelemetry
//dotnet add package OpenTelemetry.Extensions.Hosting
//dotnet add package OpenTelemetry.Instrumentation.AspNetCore
//dotnet add package OpenTelemetry.Instrumentation.Http
//dotnet add package Azure.Monitor.OpenTelemetry.Exporter
//
using Azure.Monitor.OpenTelemetry.Exporter;
//using OpenTelemetry;
using OpenTelemetry.Metrics;
using OpenTelemetry.Resources;
using OpenTelemetry.Trace;
using System.Diagnostics;

var builder = WebApplication.CreateBuilder(args);

// Configure OpenTelemetry with a resource (service name)
var resourceBuilder = ResourceBuilder.CreateDefault()
    .AddService(serviceName: builder.Environment.ApplicationName)
    .AddTelemetrySdk();

// Add OpenTelemetry Tracing and Metrics for Azure Application Insights
builder.Services.AddOpenTelemetry()
    //.ConfigureResource(resourceBuilder)
    .ConfigureResource(rb => rb = resourceBuilder) //*****
    .WithTracing(tracerProviderBuilder =>
    {
       tracerProviderBuilder
           .AddSource("MinimalApiSample")
           .AddAspNetCoreInstrumentation(options =>
           {
              options.RecordException = true;
           })
           .AddHttpClientInstrumentation()
           .AddAzureMonitorTraceExporter(options =>
           {
              options.ConnectionString = builder.Configuration["APPLICATIONINSIGHTS_CONNECTION_STRING"];
           });
    })
    .WithMetrics(metricsProviderBuilder =>
    {
       metricsProviderBuilder
           .AddAspNetCoreInstrumentation()
           .AddHttpClientInstrumentation()
           .AddAzureMonitorMetricExporter(options =>
           {
              options.ConnectionString = builder.Configuration["APPLICATIONINSIGHTS_CONNECTION_STRING"];
           });
    });

var app = builder.Build();

// Example of a custom activity for tracing
var activitySource = new ActivitySource("MinimalApiSample");

app.MapGet("/", () =>
{
   using var activity = activitySource.StartActivity("RootEndpoint");
   activity?.SetTag("custom.tag", "Hello, Azure Application Insights!");
   return Results.Ok("Hello, Azure Application Insights!");
});

app.MapGet("/metrics", () =>
{
   return Results.Ok("Metrics and traces are being sent to Azure Application Insights.");
});

app.Run();
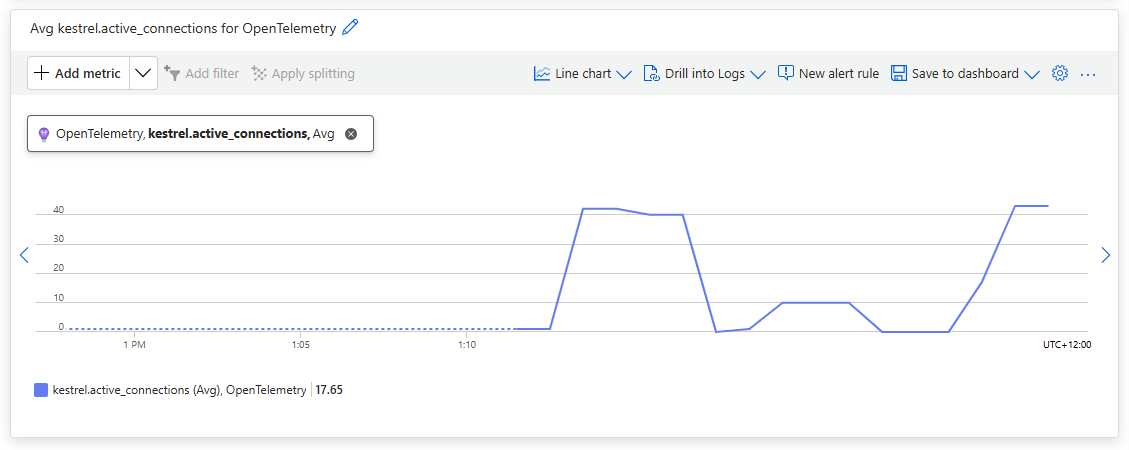
Using Application Insights metrics the Kestral.active_connections graphs to shows some of the additional telemetry emitted by the application.
//dotnet add package OpenTelemetry
//dotnet add package OpenTelemetry.Extensions.Hosting
//dotnet add package OpenTelemetry.Instrumentation.AspNetCore
//dotnet add package OpenTelemetry.Instrumentation.Http
//dotnet add package Azure.Monitor.OpenTelemetry.Exporter
//
using Azure.Monitor.OpenTelemetry.Exporter;
//using OpenTelemetry;
using OpenTelemetry.Metrics;
using OpenTelemetry.Resources;
using OpenTelemetry.Trace;
using System.Diagnostics;
using System.Diagnostics.Metrics;

var builder = WebApplication.CreateBuilder(args);

// Configure OpenTelemetry with a resource (service name)
var resourceBuilder = ResourceBuilder.CreateDefault()
    .AddService(serviceName: builder.Environment.ApplicationName)
    .AddTelemetrySdk();

// Create a meter for custom metrics
var meter = new Meter("MinimalApiSample.Metrics");
var metricsCounter = meter.CreateCounter<int>("MetricsEndpointAccessCount");

// Add OpenTelemetry Tracing and Metrics for Azure Application Insights
builder.Services.AddOpenTelemetry()
    //.ConfigureResource(resourceBuilder) /**** This is the only compile time issue
    .ConfigureResource(rb=>rb =  resourceBuilder)
    .WithTracing(tracerProviderBuilder =>
    {
       tracerProviderBuilder
           .AddSource("MinimalApiSample")
           .AddAspNetCoreInstrumentation(options =>
           {
              options.RecordException = true;
           })
           .AddHttpClientInstrumentation()
           .AddAzureMonitorTraceExporter(options =>
           {
              options.ConnectionString = builder.Configuration["APPLICATIONINSIGHTS_CONNECTION_STRING"];
           });
    })
    .WithMetrics(metricsProviderBuilder =>
    {
       metricsProviderBuilder
           .AddAspNetCoreInstrumentation()
           .AddHttpClientInstrumentation()
           .AddMeter("MinimalApiSample.Metrics") // Add your custom meter
           .AddAzureMonitorMetricExporter(options =>
           {
              options.ConnectionString = builder.Configuration["APPLICATIONINSIGHTS_CONNECTION_STRING"];
           });
    });

var app = builder.Build();

// Example of a custom activity for tracing
var activitySource = new ActivitySource("MinimalApiSample");

app.MapGet("/", () =>
{
   using var activity = activitySource.StartActivity("RootEndpoint");
   activity?.SetTag("custom.tag", "Hello, Azure Application Insights!");
   return Results.Ok("Hello, Azure Application Insights!");
});

app.MapGet("/metrics", () =>
{
   // Increment custom metric on each access
   metricsCounter.Add(1);
   return Results.Ok("Metrics and traces are being sent to Azure Application Insights.");
});

app.Run();
I by pleasantly surprised by suggestion of a counter for each endpoint which was my original intent.
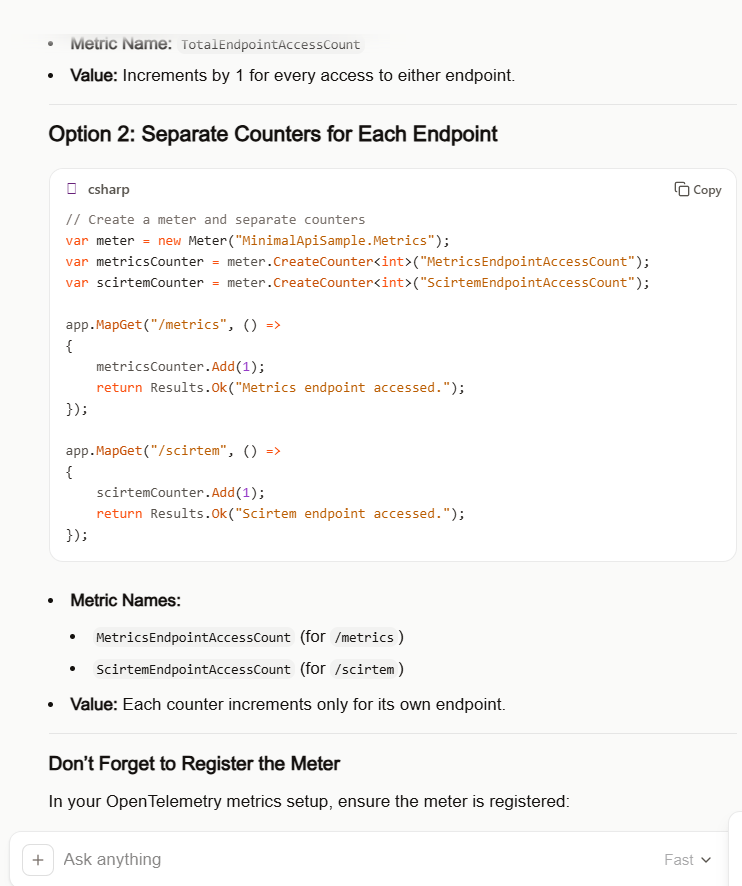
Couldn’t think of a better name “scirtem” is “metrics” backwards. The way Meter and CreateCount are global would not be a good idea in a more complex system but this is fine for a hacky PoC.
//dotnet add package OpenTelemetry
//dotnet add package OpenTelemetry.Extensions.Hosting
//dotnet add package OpenTelemetry.Instrumentation.AspNetCore
//dotnet add package OpenTelemetry.Instrumentation.Http
//dotnet add package Azure.Monitor.OpenTelemetry.Exporter
//
using Azure.Monitor.OpenTelemetry.Exporter;
//using OpenTelemetry;  //***** Unnecessary with OpenTelemetry.Extensions.Hosting
using OpenTelemetry.Metrics;
using OpenTelemetry.Resources;
using OpenTelemetry.Trace;
using System.Diagnostics;
using System.Diagnostics.Metrics;

var builder = WebApplication.CreateBuilder(args);

// Configure OpenTelemetry with a resource (service name)
var resourceBuilder = ResourceBuilder.CreateDefault()
    .AddService(serviceName: builder.Environment.ApplicationName)
    .AddTelemetrySdk();

// Create a meter for custom metrics
var meter = new Meter("MinimalApiSample.Metrics");
var metricsCounter = meter.CreateCounter<int>("MetricsEndpointAccessCount");
var scirtemCounter = meter.CreateCounter<int>("ScirtemEndpointAccessCount");

// Add OpenTelemetry Tracing and Metrics for Azure Application Insights
builder.Services.AddOpenTelemetry()
    //.ConfigureResource(resourceBuilder) /**** This is the only compile time issue
    .ConfigureResource(rb=>rb =  resourceBuilder)
    .WithTracing(tracerProviderBuilder =>
    {
       tracerProviderBuilder
           .AddSource("MinimalApiSample")
           .AddAspNetCoreInstrumentation(options =>
           {
              options.RecordException = true;
           })
           .AddHttpClientInstrumentation()
           .AddAzureMonitorTraceExporter(options =>
           {
              options.ConnectionString = builder.Configuration["APPLICATIONINSIGHTS_CONNECTION_STRING"];
           });
    })
    .WithMetrics(metricsProviderBuilder =>
    {
       metricsProviderBuilder
           .AddAspNetCoreInstrumentation()
           .AddHttpClientInstrumentation()
           .AddMeter("MinimalApiSample.Metrics") // Add your custom meter
           .AddAzureMonitorMetricExporter(options =>
           {
              options.ConnectionString = builder.Configuration["APPLICATIONINSIGHTS_CONNECTION_STRING"];
           });
    });

var app = builder.Build();

// Example of a custom activity for tracing
var activitySource = new ActivitySource("MinimalApiSample");

app.MapGet("/", () =>
{
   using var activity = activitySource.StartActivity("RootEndpoint");
   activity?.SetTag("custom.tag", "Hello, Azure Application Insights!");
   return Results.Ok("Hello, Azure Application Insights!");
});

app.MapGet("/metrics", () =>
{
   // Increment custom metric on each access
   metricsCounter.Add(1);
   return Results.Ok("Metrics and traces are being sent to Azure Application Insights.");
});

app.MapGet("/scirtem", () =>
{
   scirtemCounter.Add(1);
   return Results.Ok("Scirtem endpoint accessed.");
});

app.Run();
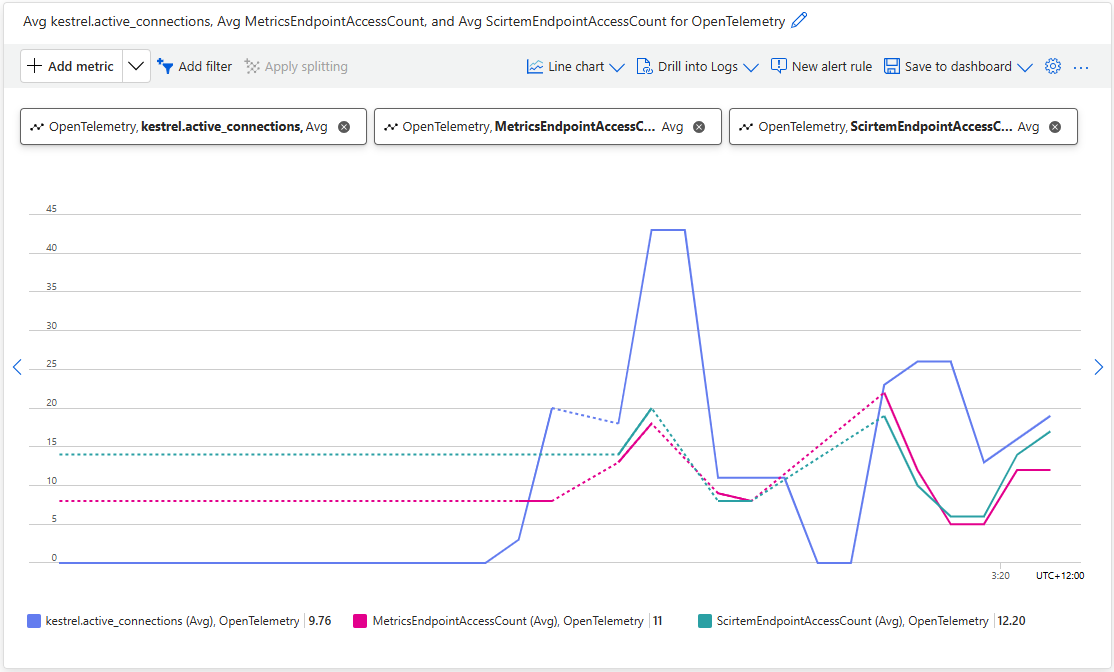
Using Application Insights metrics the MetricsEndPointAccesCount, and ScirtemEndPointAccesCount, plots to show the OLTP telemetry emitted by the application.
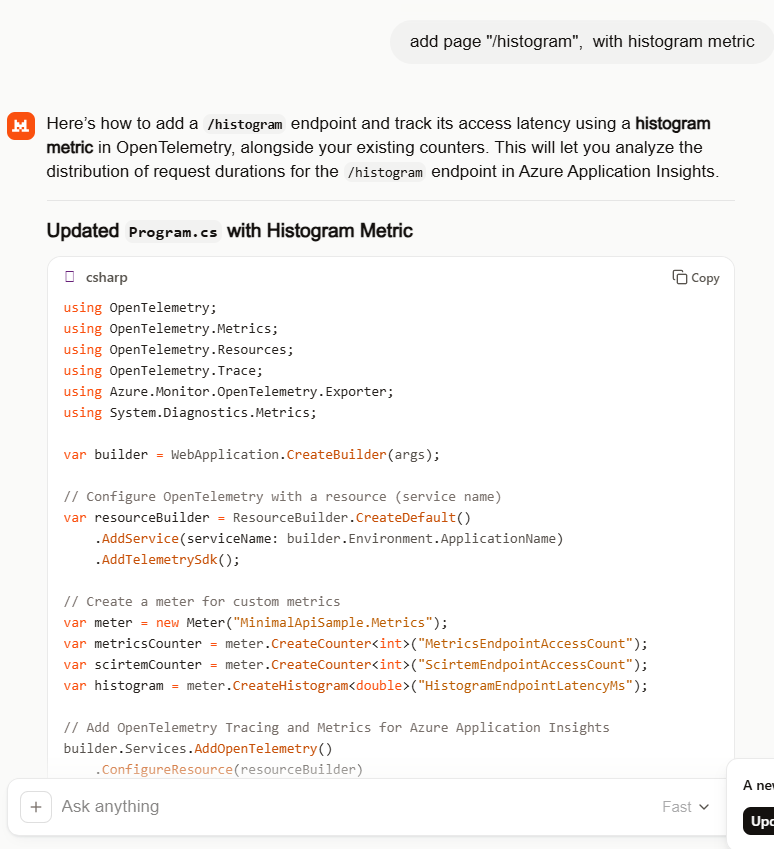
Mistral generated the code for the endpoint latency histogram without any prompting.
//dotnet add package OpenTelemetry
//dotnet add package OpenTelemetry.Extensions.Hosting
//dotnet add package OpenTelemetry.Instrumentation.AspNetCore
//dotnet add package OpenTelemetry.Instrumentation.Http
//dotnet add package Azure.Monitor.OpenTelemetry.Exporter
//
using Azure.Monitor.OpenTelemetry.Exporter;
//using OpenTelemetry;
using OpenTelemetry.Metrics;
using OpenTelemetry.Resources;
using OpenTelemetry.Trace;
using System.Diagnostics;
using System.Diagnostics.Metrics;

var builder = WebApplication.CreateBuilder(args);

// Configure OpenTelemetry with a resource (service name)
var resourceBuilder = ResourceBuilder.CreateDefault()
    .AddService(serviceName: builder.Environment.ApplicationName)
    .AddTelemetrySdk();

// Create a meter for custom metrics
var meter = new Meter("MinimalApiSample.Metrics");
var metricsCounter = meter.CreateCounter<int>("MetricsEndpointAccessCount");
var scirtemCounter = meter.CreateCounter<int>("ScirtemEndpointAccessCount");
var histogram = meter.CreateHistogram<double>("HistogramEndpointLatencyMs");

// Add OpenTelemetry Tracing and Metrics for Azure Application Insights
builder.Services.AddOpenTelemetry()
    //.ConfigureResource(resourceBuilder) /**** This is the only compile time issue
    .ConfigureResource(rb=>rb =  resourceBuilder)
    .WithTracing(tracerProviderBuilder =>
    {
       tracerProviderBuilder
           .AddSource("MinimalApiSample")
           .AddAspNetCoreInstrumentation(options =>
           {
              options.RecordException = true;
           })
           .AddHttpClientInstrumentation()
           .AddAzureMonitorTraceExporter(options =>
           {
              options.ConnectionString = builder.Configuration["APPLICATIONINSIGHTS_CONNECTION_STRING"];
           });
    })
    .WithMetrics(metricsProviderBuilder =>
    {
       metricsProviderBuilder
           .AddAspNetCoreInstrumentation()
           .AddHttpClientInstrumentation()
           .AddMeter("MinimalApiSample.Metrics") // Register your custom meter
           .AddAzureMonitorMetricExporter(options =>
           {
              options.ConnectionString = builder.Configuration["APPLICATIONINSIGHTS_CONNECTION_STRING"];
           });
    });

var app = builder.Build();

// Example of a custom activity for tracing
var activitySource = new ActivitySource("MinimalApiSample");

app.MapGet("/", () =>
{
   using var activity = activitySource.StartActivity("RootEndpoint");
   activity?.SetTag("custom.tag", "Hello, Azure Application Insights!");
   return Results.Ok("Hello, Azure Application Insights!");
});

app.MapGet("/metrics", () =>
{
   metricsCounter.Add(1);
   return Results.Ok("Metrics endpoint accessed.");
});

app.MapGet("/scirtem", () =>
{
   scirtemCounter.Add(1);
   return Results.Ok("Scirtem endpoint accessed.");
});

app.MapGet("/histogram", async () =>
{
   // Simulate some work
   var startTime = Stopwatch.GetTimestamp();
   await Task.Delay(Random.Shared.Next(50, 200)); // Random delay between 50-200ms
   var endTime = Stopwatch.GetTimestamp();

   // Calculate latency in milliseconds
   var latencyMs = (endTime - startTime) * 1000.0 / Stopwatch.Frequency;
   histogram.Record(latencyMs);

   return Results.Ok($"Histogram endpoint accessed. Latency: {latencyMs:F2}ms");
});

app.Run();
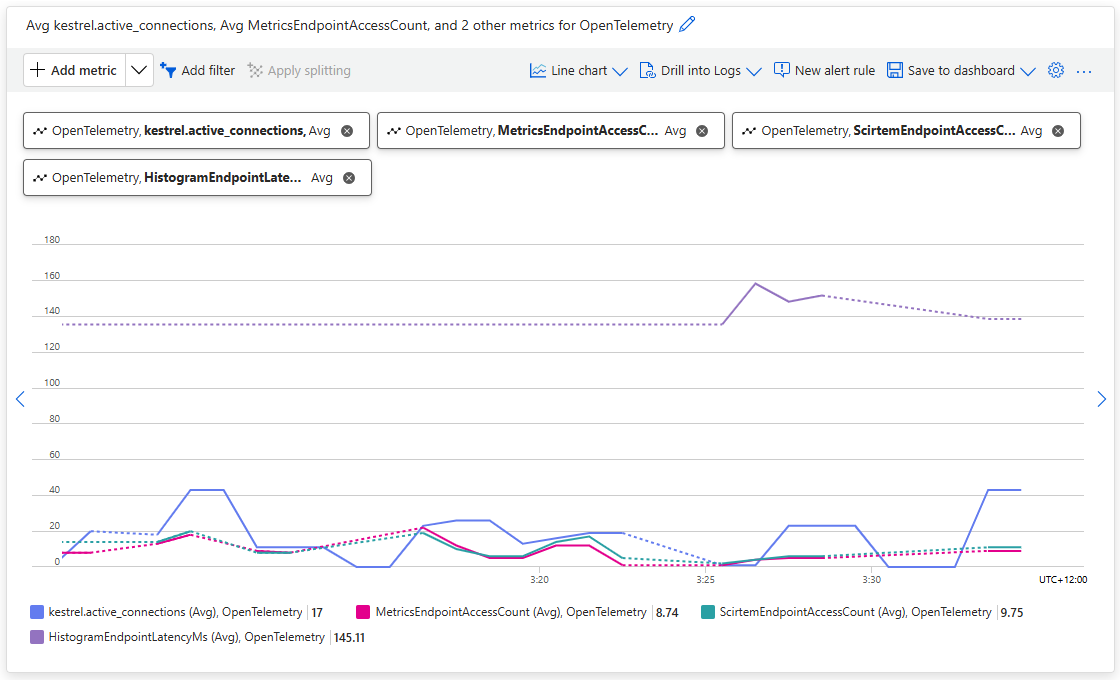
Using Application Insights metrics the OpenTelemetry.HistogramEndpointLatencyMs plot to show the OLTP telemetry emitted by the application.
Even with my relatively trivial OTLP learning applications, Mistral consistently produced clean and usable code with my simple prompts (maybe, I have got better and prompting). The generated code was straightforward, required only minor fixes, and avoided much of the over-complexity I’d seen in earlier experiments with other tools (looking at you mid/late 2025 Copilot). For my simple OTLP observability learning scenarios, that translated into faster iteration and less time spent refactoring and debugging generated code.