Random wanderings through Microsoft Azure esp. PaaS plumbing, the IoT bits, AI on Micro controllers, AI on Edge Devices, .NET nanoFramework, .NET Core on *nix and ML.NET+ONNX
When I first ran the code no data was received so I doubled checked the serial connections and figured out I had to modify the cable and reverse the TX and RX pins.
The thread '<No Name>' (0x2) has exited with code 0 (0x0).
devMobile.IoT.Rak811LoRaWanDeviceClient starting
12:00:12 Region AS923
12:00:12 ADR On
12:00:12 Unconfirmed
12:00:12 OTAA
12:00:13 Join start Timeout:30Sec
Join failed 26
The thread '<No Name>' (0x1) has exited with code 0 (0x0).
Done.
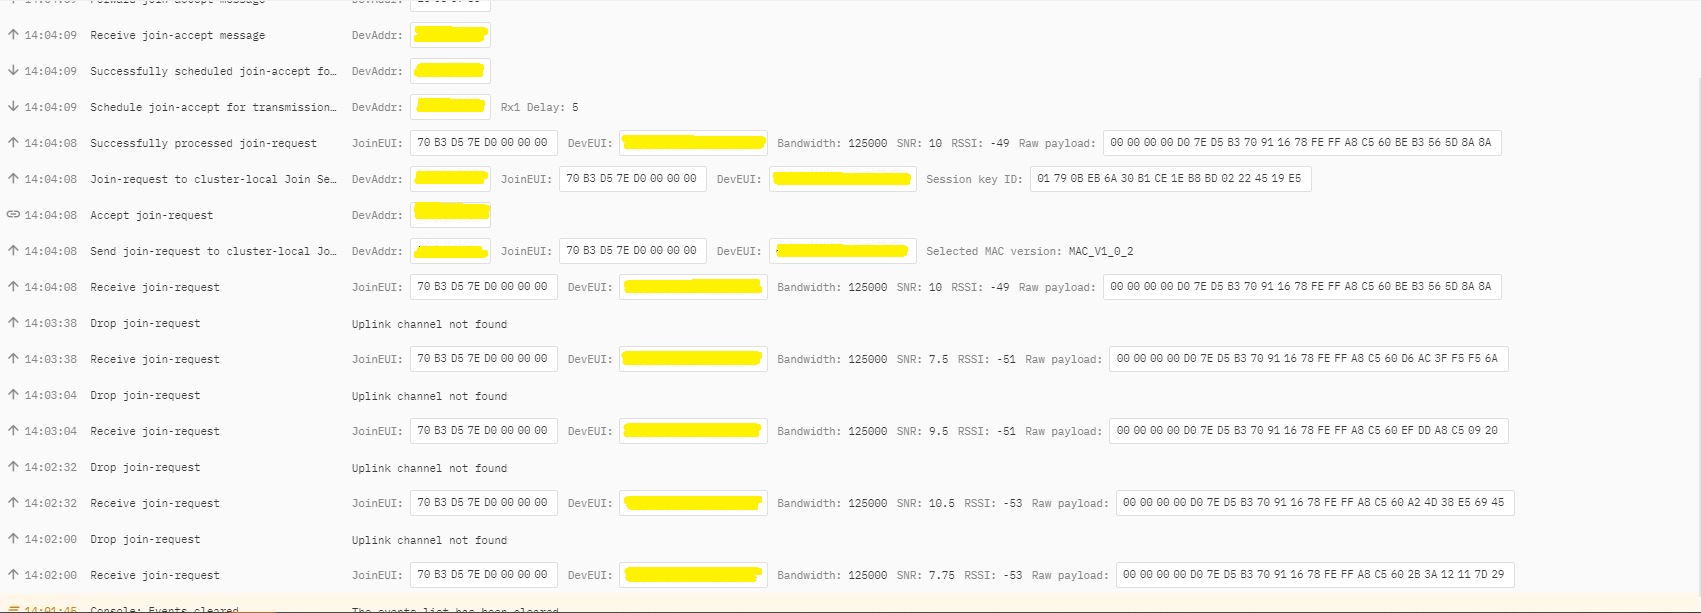
In TTI end device live data tab I could see the the joins attempts were failing with “Uplink channel Not found”
The Things Industries device live data tab “uplink channel not found” failures
The Things Industries device live data tab “uplink channel not found” detail
Initially I assumed this was an issue with my configuration of the RAKwirelessRAK7258 gateway in my office that I was using for testing. After some discussions with a helpful TTI support person they suggested that I try disabling all bar the first two channels the RAK811 module was configured to use then see if worked.
I modified the intialise method of my TinyCLR V2 RAK811 Module library to disable all bar the first two channels
result = SendCommand("OK", "at+set_config=lora:ch_mask:2:0", CommandTimeoutDefault);
if (result != Result.Success)
{
#if DIAGNOSTICS
   Debug.WriteLine($" {DateTime.UtcNow:hh:mm:ss} at+set_config=lora:ch_mask:2:0 {result}");
#endif
   return result;
}

result = SendCommand("OK", "at+set_config=lora:ch_mask:3:0", CommandTimeoutDefault);
if (result != Result.Success)
{
#if DIAGNOSTICS
   Debug.WriteLine($" {DateTime.UtcNow:hh:mm:ss} at+set_config=lora:ch_mask:3:0 {result}");
#endif
   return result;
}

result = SendCommand("OK", "at+set_config=lora:ch_mask:4:0", CommandTimeoutDefault);
if (result != Result.Success)
{
#if DIAGNOSTICS
   Debug.WriteLine($" {DateTime.UtcNow:hh:mm:ss} at+set_config=lora:ch_mask:4:0 {result}");
#endif
   return result;
}

result = SendCommand("OK", "at+set_config=lora:ch_mask:5:0", CommandTimeoutDefault);
if (result != Result.Success)
{
#if DIAGNOSTICS
    Debug.WriteLine($" {DateTime.UtcNow:hh:mm:ss} at+set_config=lora:ch_mask:5:0 {result}");
#endif
   return result;
}

result = SendCommand("OK", "at+set_config=lora:ch_mask:6:0", CommandTimeoutDefault);
if (result != Result.Success)
{
#if DIAGNOSTICS
   Debug.WriteLine($" {DateTime.UtcNow:hh:mm:ss} at+set_config=lora:ch_mask:6:0 {result}");
#endif
   return result;
}

result = SendCommand("OK", "at+set_config=lora:ch_mask:7:0", CommandTimeoutDefault);
if (result != Result.Success)
{
#if DIAGNOSTICS
   Debug.WriteLine($" {DateTime.UtcNow:hh:mm:ss} at+set_config=lora:ch_mask:7:0 {result}");
#endif
   return result;
}
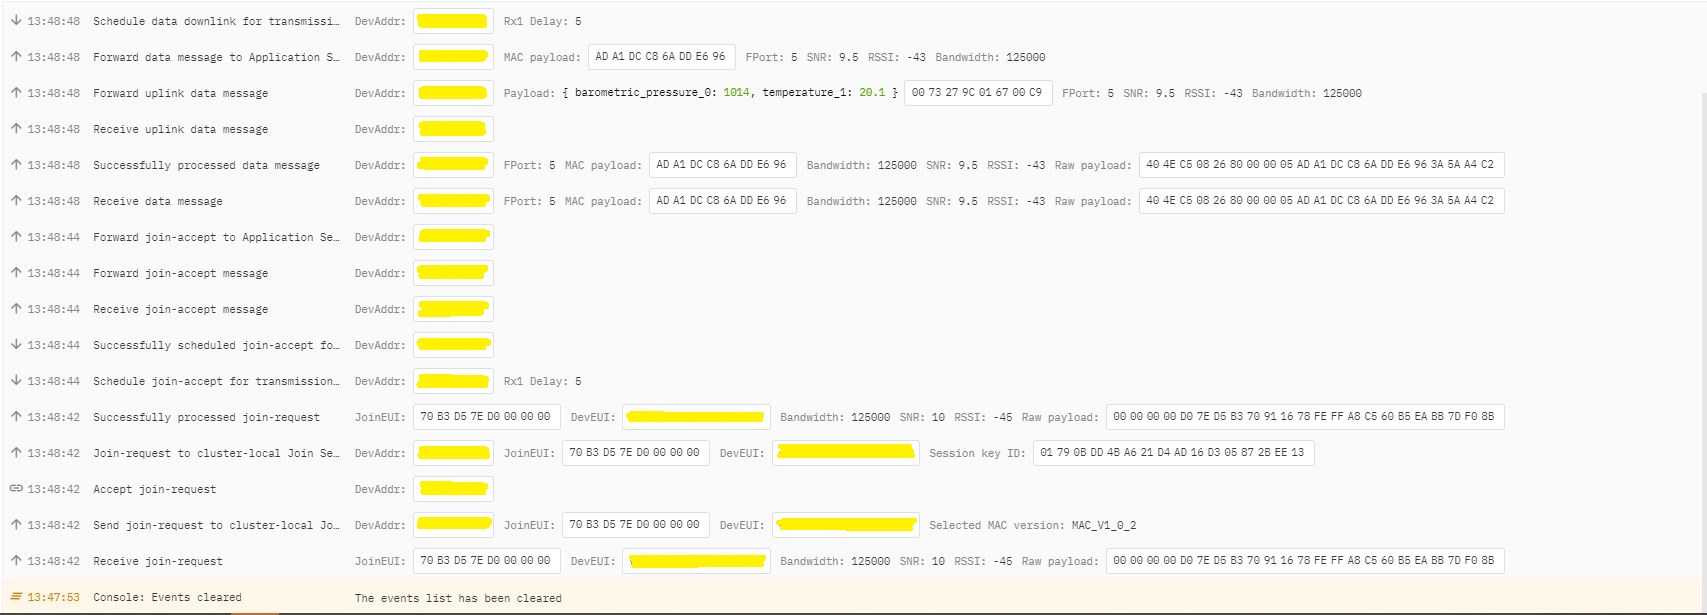
After modifying the code my Fezduino joined reliably.
The thread ” (0x2) has exited with code 0 (0x0). devMobile.IoT.Rak811LoRaWanDeviceClient starting 12:00:12 Region AS923 12:00:12 ADR On 12:00:12 Unconfirmed 12:00:12 OTAA 12:00:13 Join start Timeout:30Sec 12:00:18 Join finish Temperature : 19.9 °C Pressure : 1014.0 HPa Altitude : 143 meters 12:00:19 port:5 payload BCD:0073279C016700C8 12:00:44 Sleep 12:01:44 Wakeup Temperature : 20.1 °C Pressure : 1014.0 HPa Altitude : 143 meters 12:01:44 port:5 payload BCD:0073279C016700C9 12:02:09 Sleep
The Things Industries device live data tab successful join.
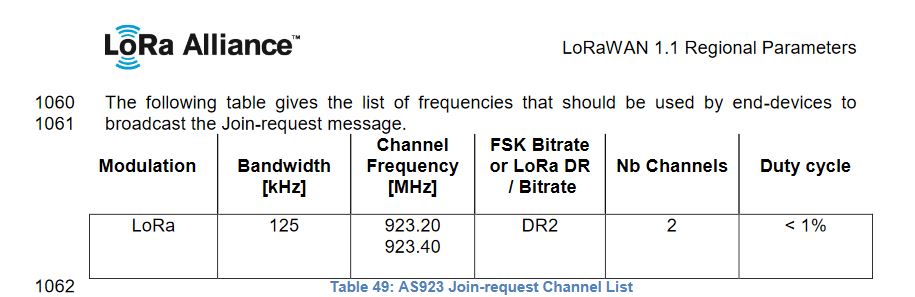
After some further discussion with TTI support it looks like the RAK811 module doesn’t send join requests on the frequencies specified for the AS923 region in the LoRaWAN™1.1Regional Parameters.
After confirming the join-request channel issue I went back to the RAKwireless forums with some new terms to search for and found that others were having a similar issue but with RAK4200 modules. My “best guess” is that the TTI implementation is more strict about join-request frequencies than the TTN
After some research I found references to the underlying problem in TTN and OpenAPI forums. The Dev_addr and Dev_eui fields are Base16(Hexidecimal) encoded binary but are being processed as if they were Base64(mime) encoded.
The TTI connector only displays the Device EUI so I changed the Dev_eui property to a string
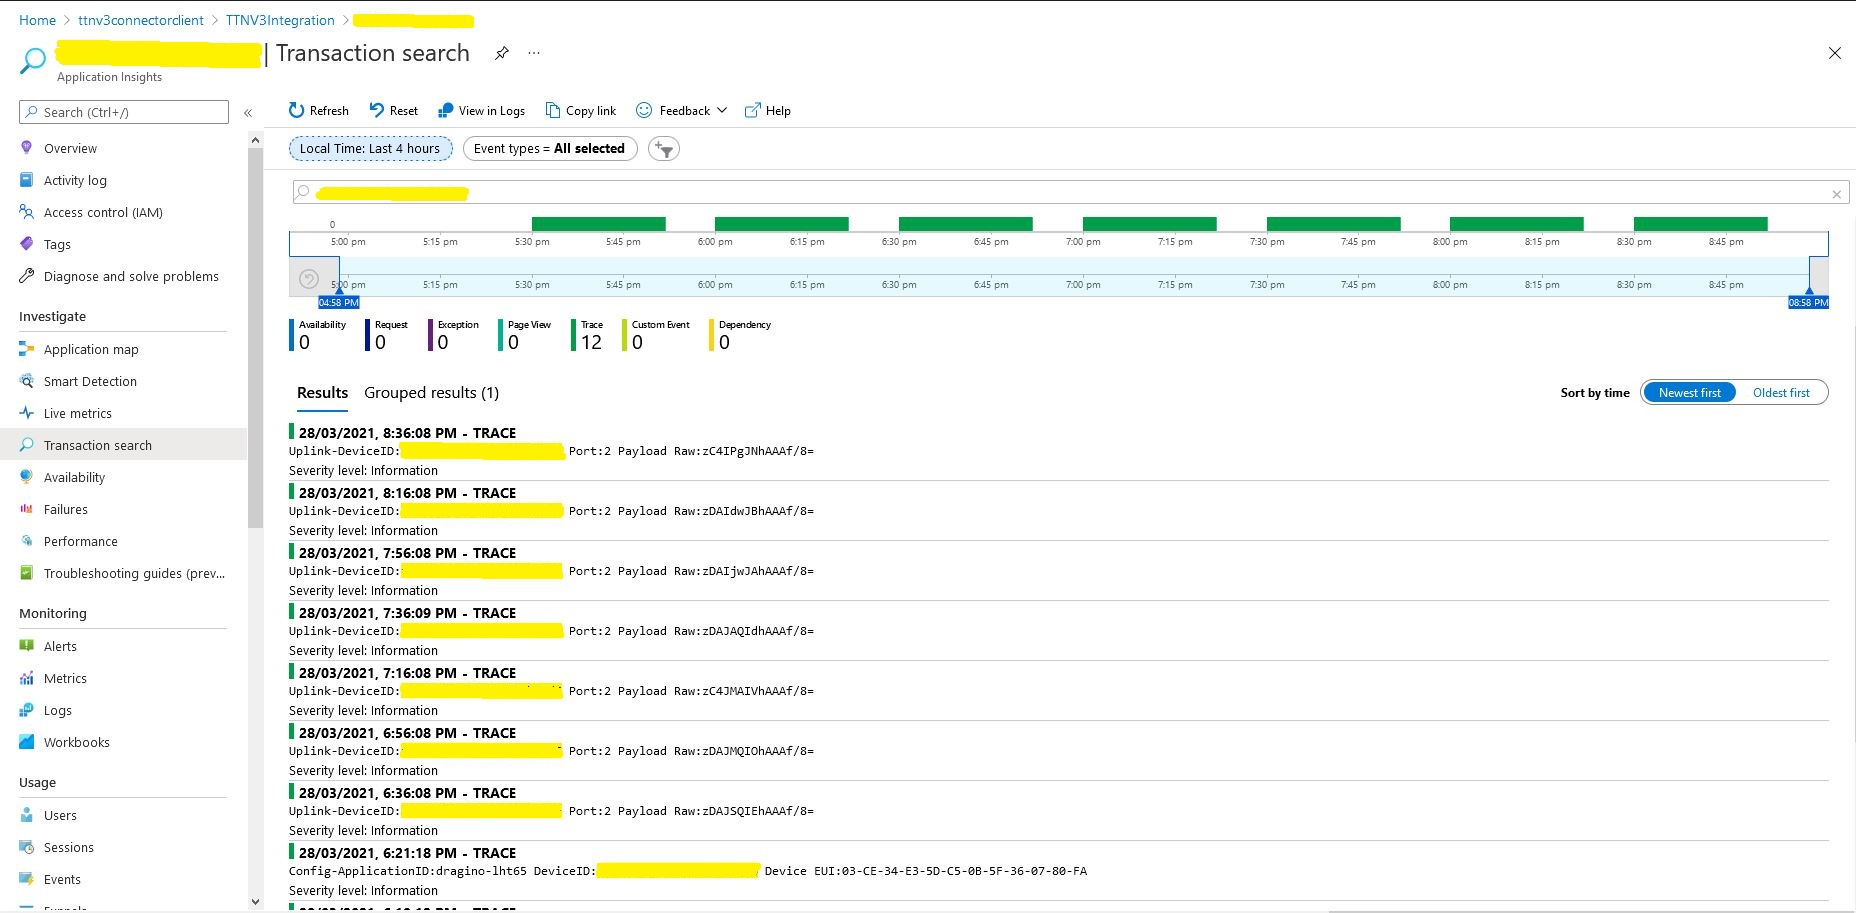
Now the DeviceEUI values are displayed correctly and searching for EndDevices in Azure Application Insights is easier
TTI V3 Connector application running as a console application showing correct DeviceEUIs
Modifying the nSwag generated classes is a really nasty way of fixing the problem but I think this approach is okay as it’s only one field and any other solution I could find was significantly more complex.
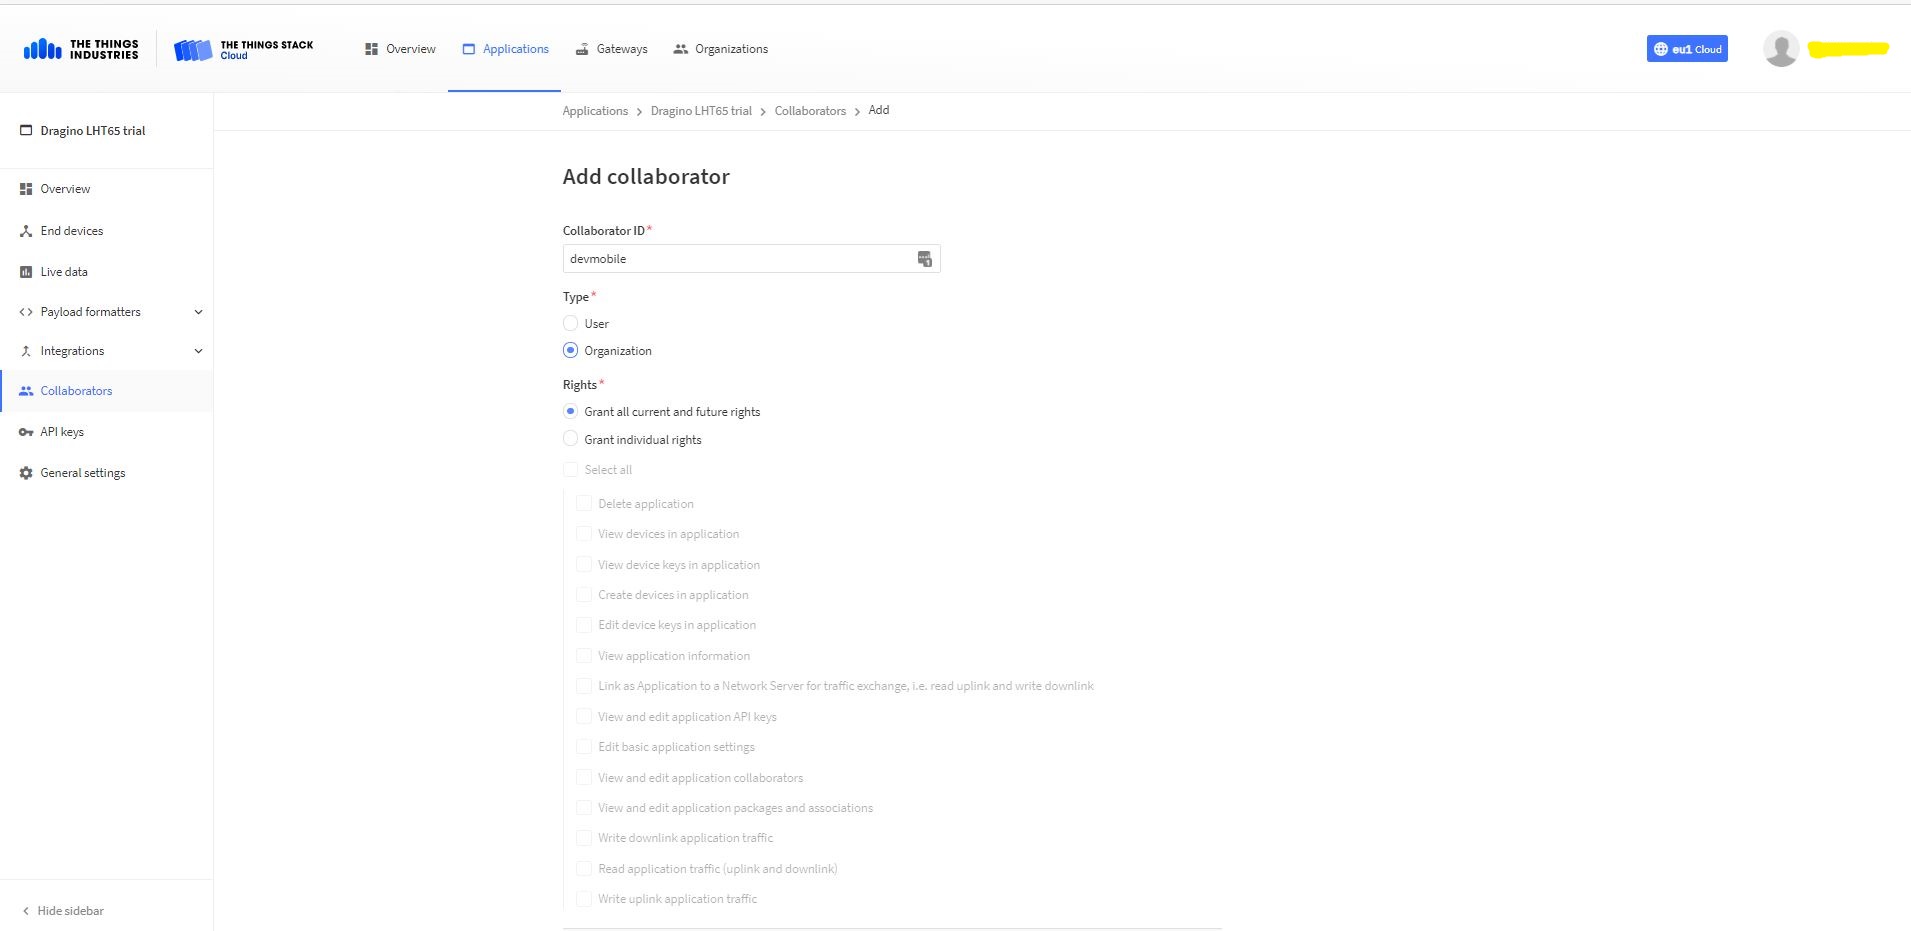
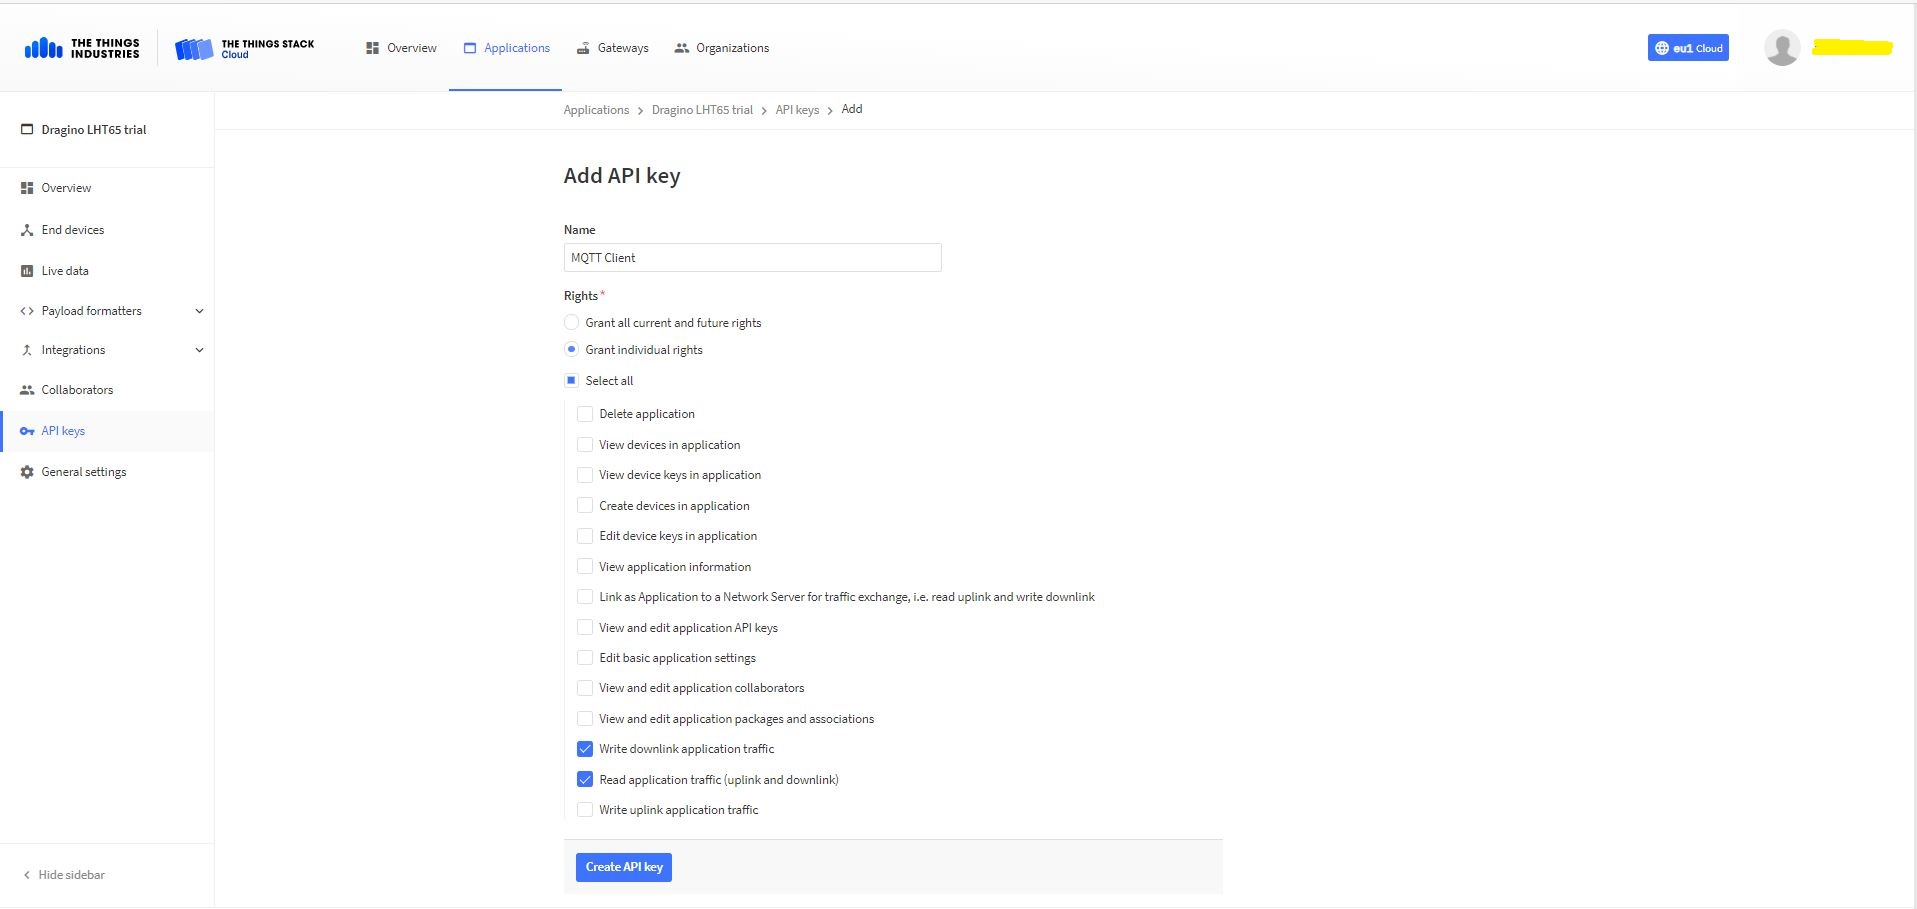
Adding devMobile as a collaborator on the new application
TTI Application API Key configuration
The new Application API Key used by the MQTTnetmanaged client only needs to have write downlink and read uplink traffic enabled.
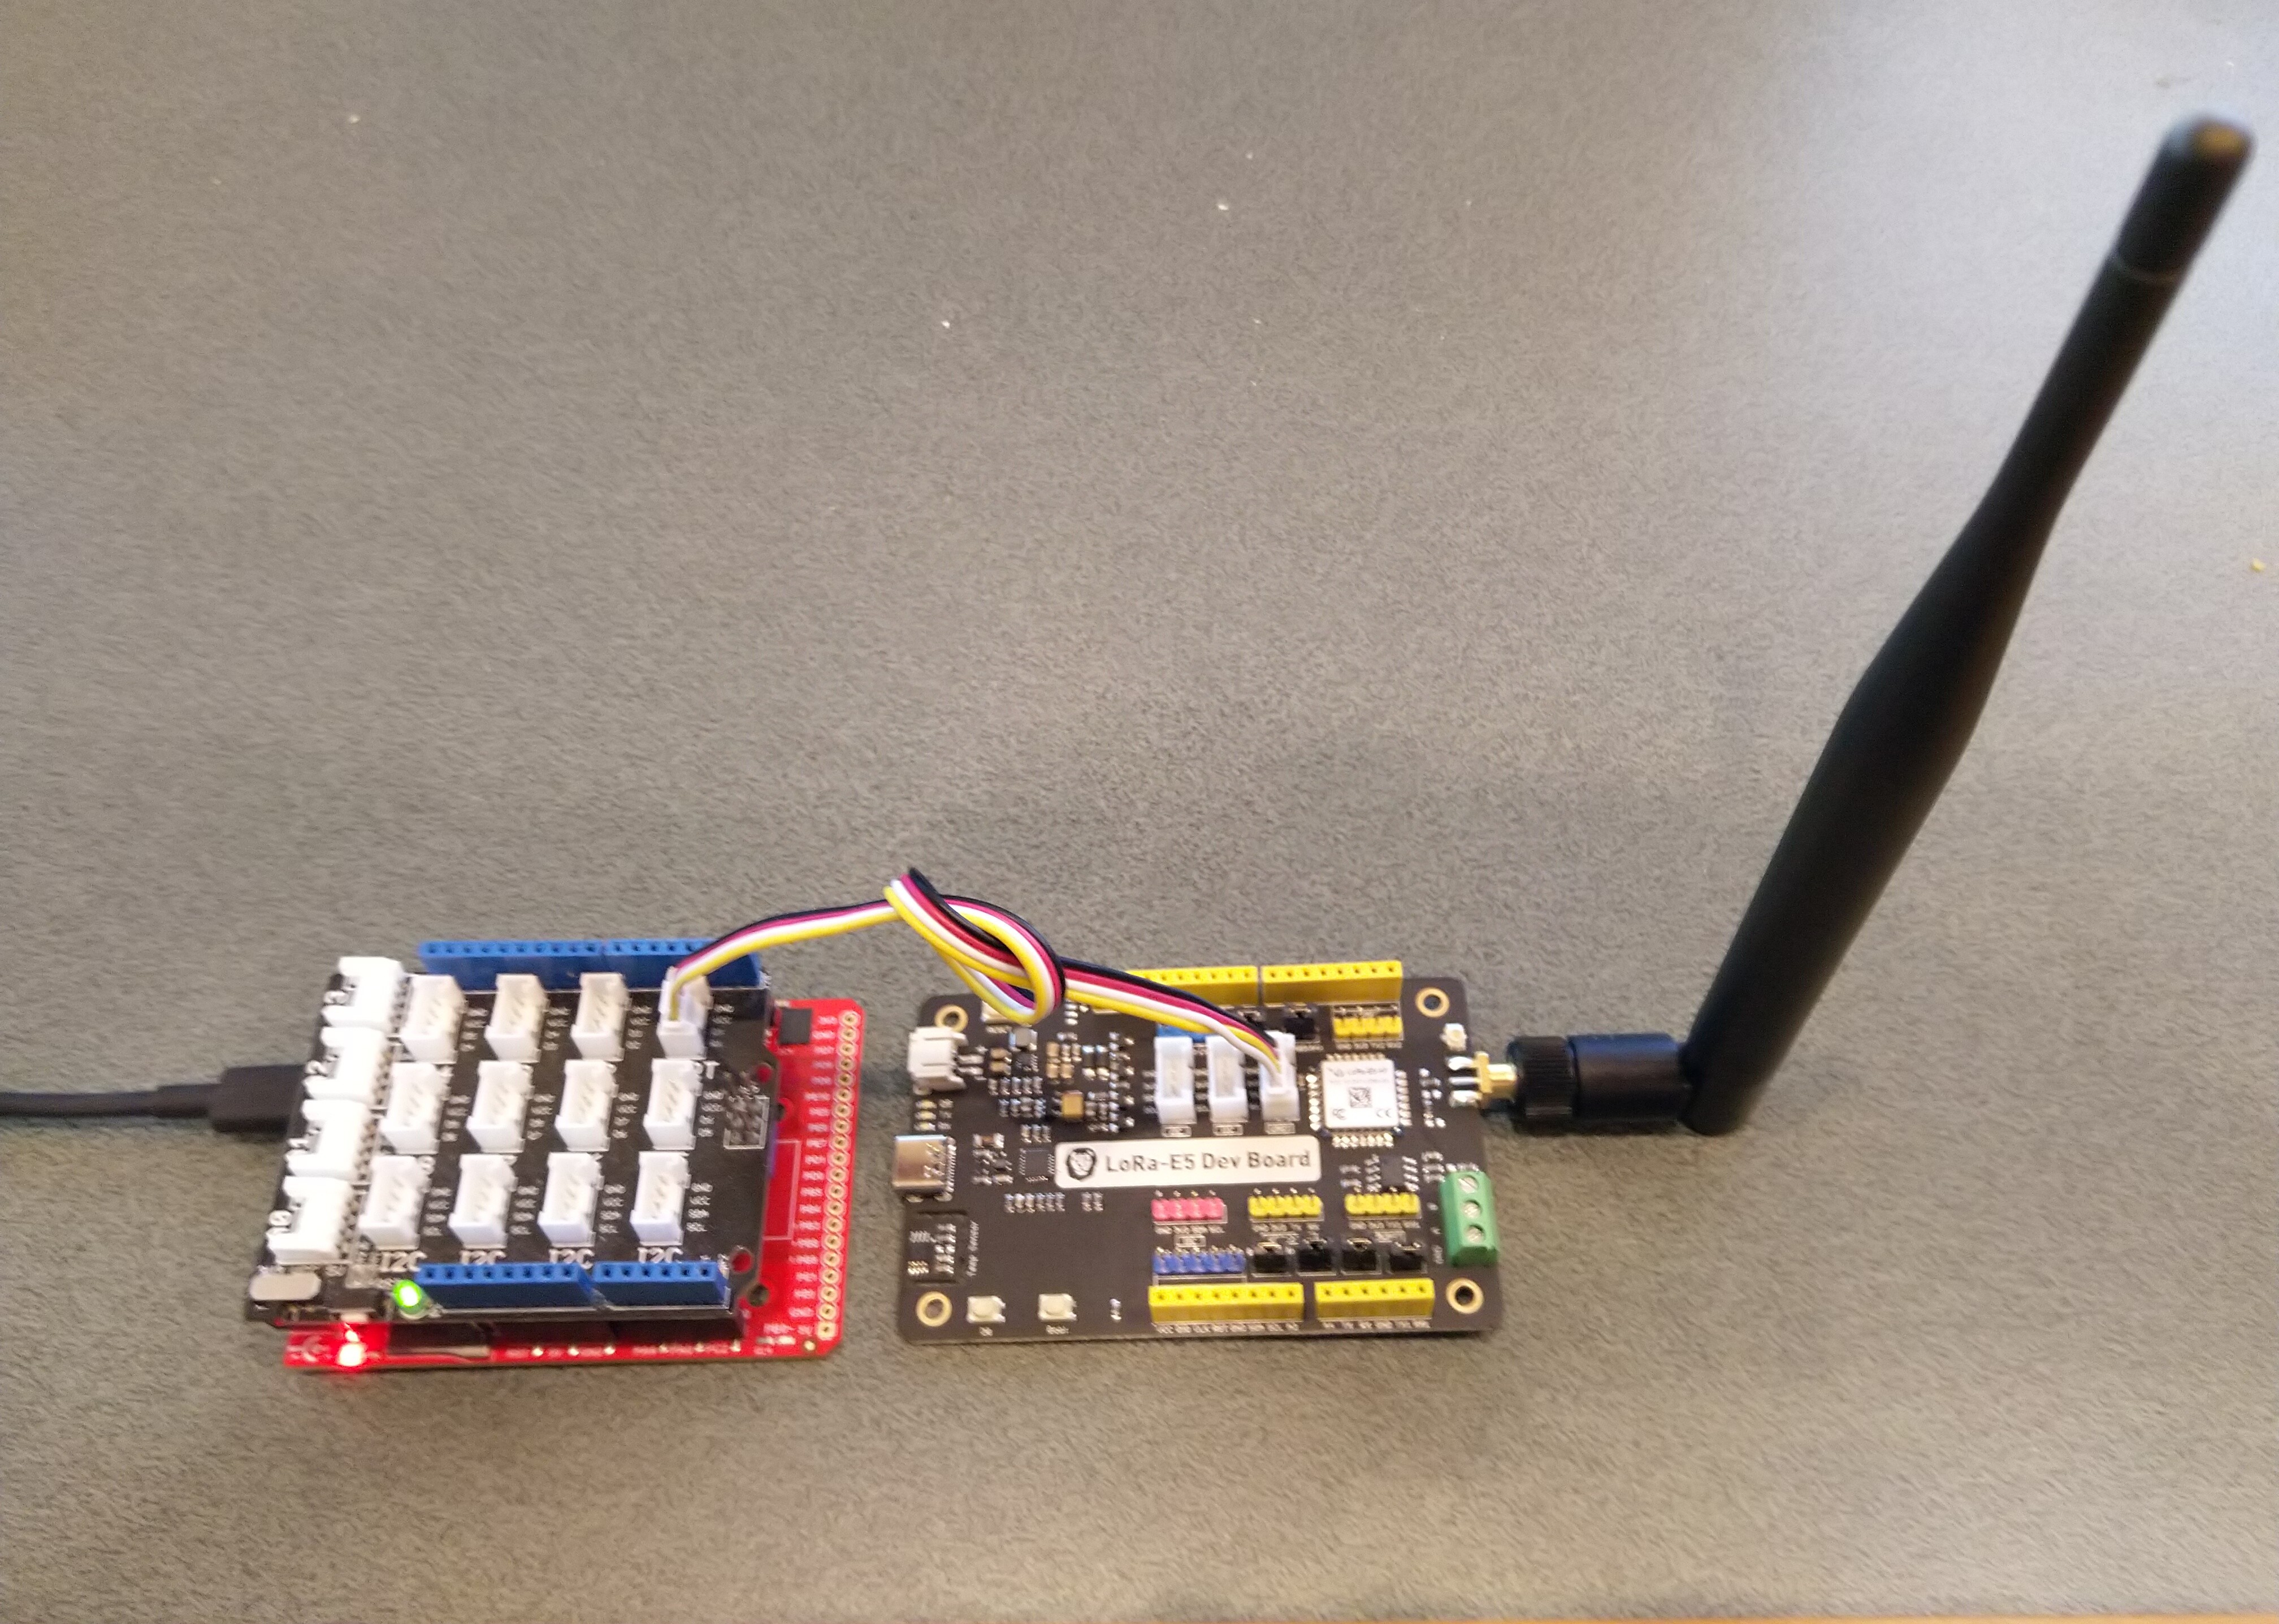
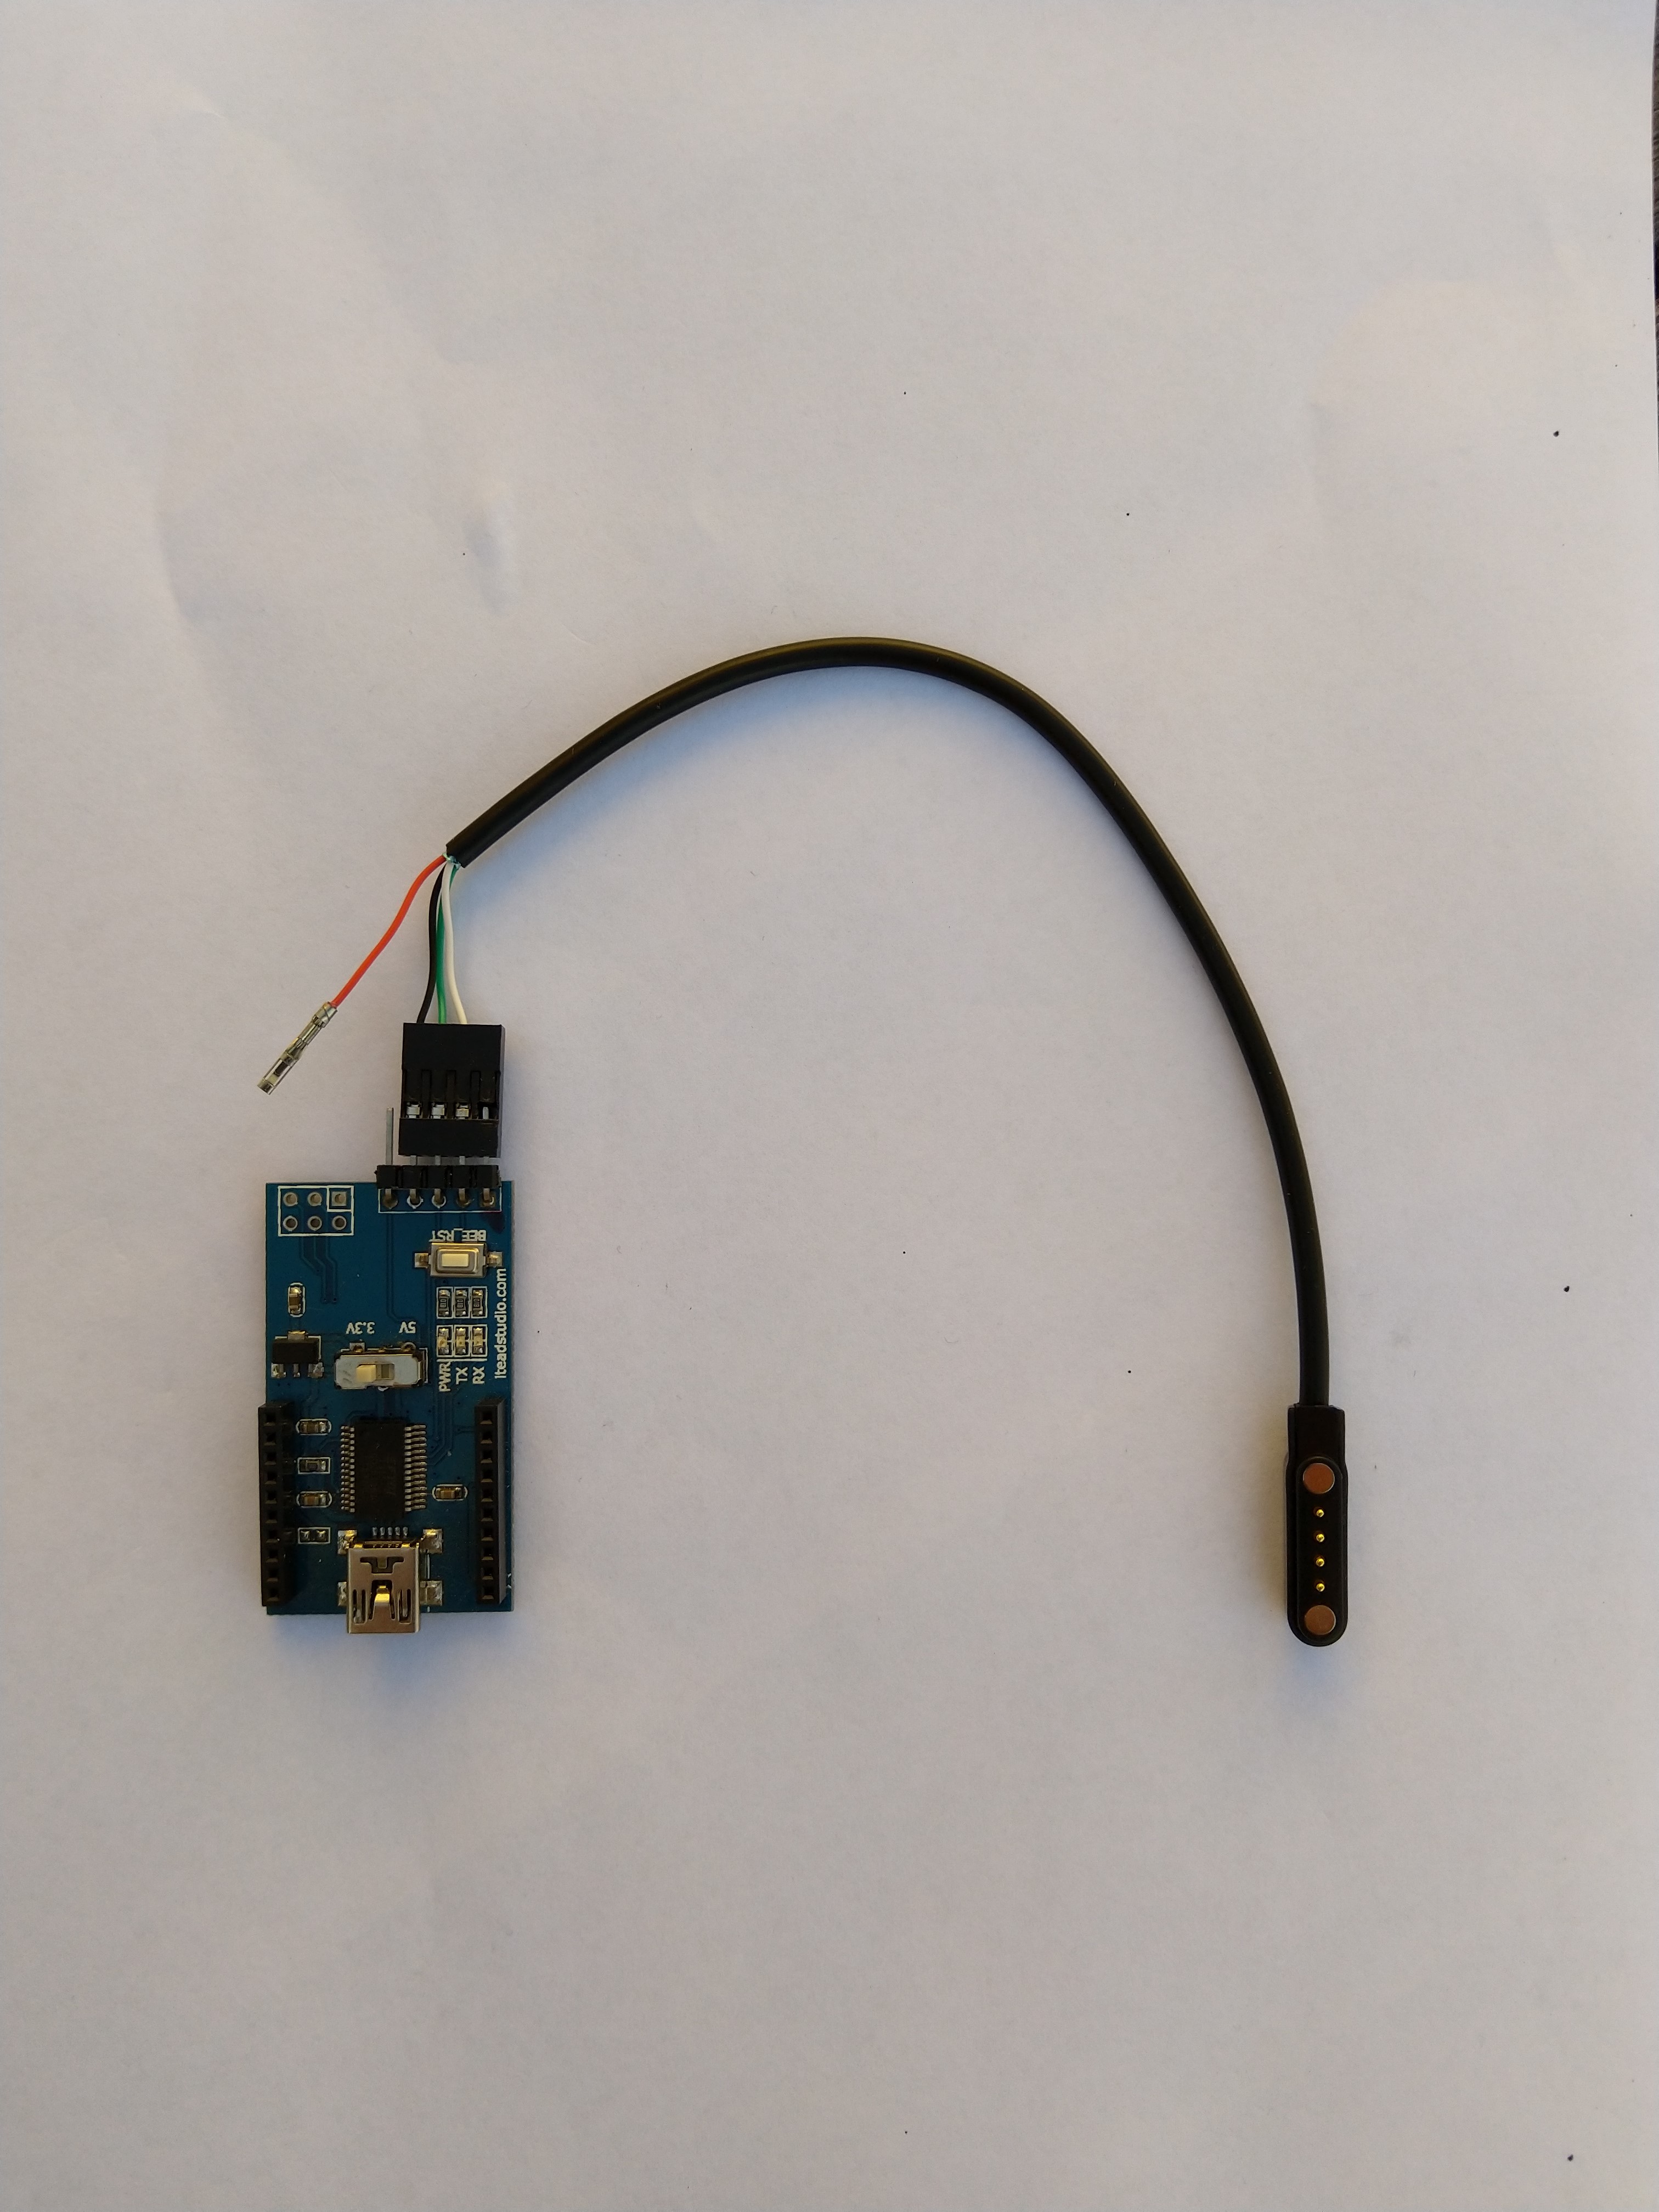
FTDI Adapter and modified LHT64 cable
So I could reliably connect to my LHT65 devices to configure them I modified a programming cable so I could use it with a spare FTDI adaptor without jumper wires. Todo this I used a small jewelers screwdriver to “pop” out the VCC cable and move the transmit data line.
After entering the device password and checking the firmware version I used the AT+CFG command to display the device settings
AT+CFG: Print all configurations

[334428]***** UpLinkCounter= 0 *****
[334430]TX on freq 923200000 Hz at DR 2
[334804]txDone
[339807]RX on freq 923200000 Hz at DR 2
[339868]rxTimeOut
[340807]RX on freq 923200000 Hz at DR 2
[340868]rxTimeOut

Correct Password

Stop Tx events,Please wait for all configurations to print
Printf all config...
AT+DEUI=a8 .. .. .. .. .. .. d6
AT+DADDR=01......D6

AT+APPKEY=9d .. .. .. .. .. .. .. .. .. .. .. .. .. .. 2e
AT+NWKSKEY=f6 .. .. .. .. .. .. .. .. .. .. .. .. .. .. 69
AT+APPSKEY=4c 35 .. .. .. .. .. .. .. .. .. .. .. .. .. 3d
AT+APPEUI=a0 .. .. .. .. .. .. 00
AT+ADR=1
AT+TXP=0
AT+DR=0
AT+DCS=0
AT+PNM=1
AT+RX2FQ=923200000
AT+RX2DR=2
AT+RX1DL=1000
AT+RX2DL=2000
AT+JN1DL=5000
AT+JN2DL=6000
AT+NJM=1
AT+NWKID=00 00 00 00
AT+FCU=0
AT+FCD=0
AT+CLASS=A
AT+NJS=0
AT+RECVB=0:
AT+RECV=0:
AT+VER=v1.7 AS923

AT+CFM=0
AT+CFS=0
AT+SNR=0
AT+RSSI=0
AT+TDC=1200000
AT+PORT=2
AT+PWORD=123456
AT+CHS=0
AT+DATE=21/3/26 07:49:15
AT+SLEEP=0
AT+EXT=4,2
AT+RTP=20
AT+BAT=3120
AT+WMOD=0
AT+ARTEMP=-40,125
AT+CITEMP=1
Start Tx events OK


[399287]***** UpLinkCounter= 0 *****

[399289]TX on freq 923400000 Hz at DR 2

[399663]txDone

[404666]RX on freq 923400000 Hz at DR 2

[404726]rxTimeOut

[405666]RX on freq 923200000 Hz at DR 2

[405726]rxTimeOut
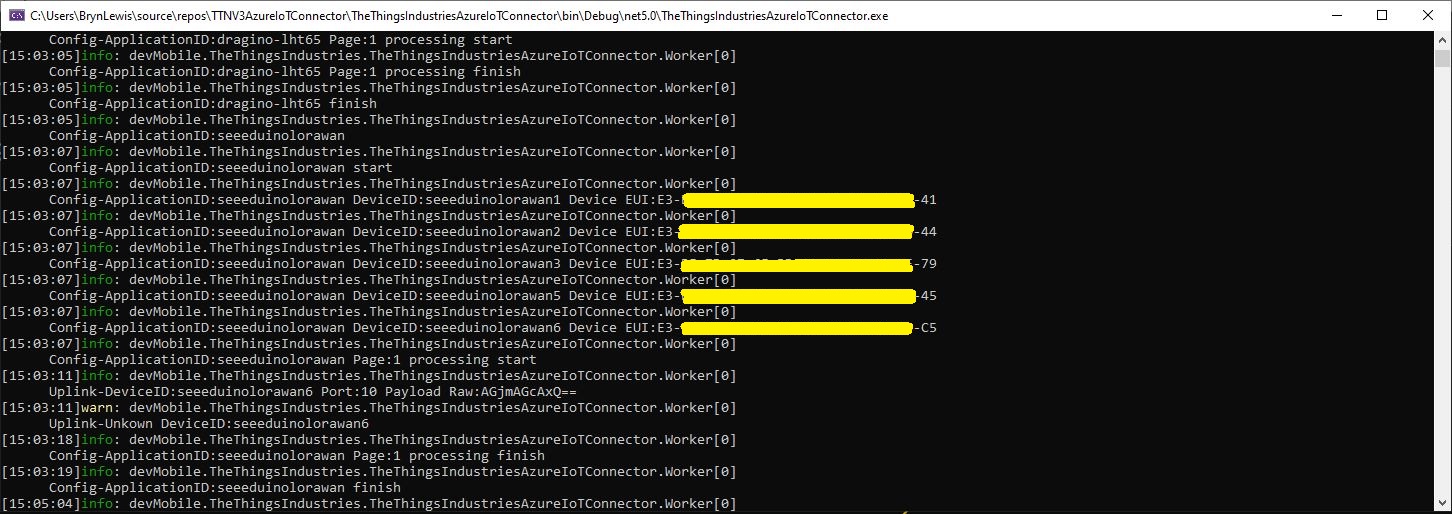
The Dragino LHT65 uses the DeviceEUI as the DeviceID which meant I had todo more redaction in my TTI/TTN and Azure Application Insights screen captures. The rules around the re-use of EndDevice ID were a pain in the arse(PITA) in my development focused tenant.
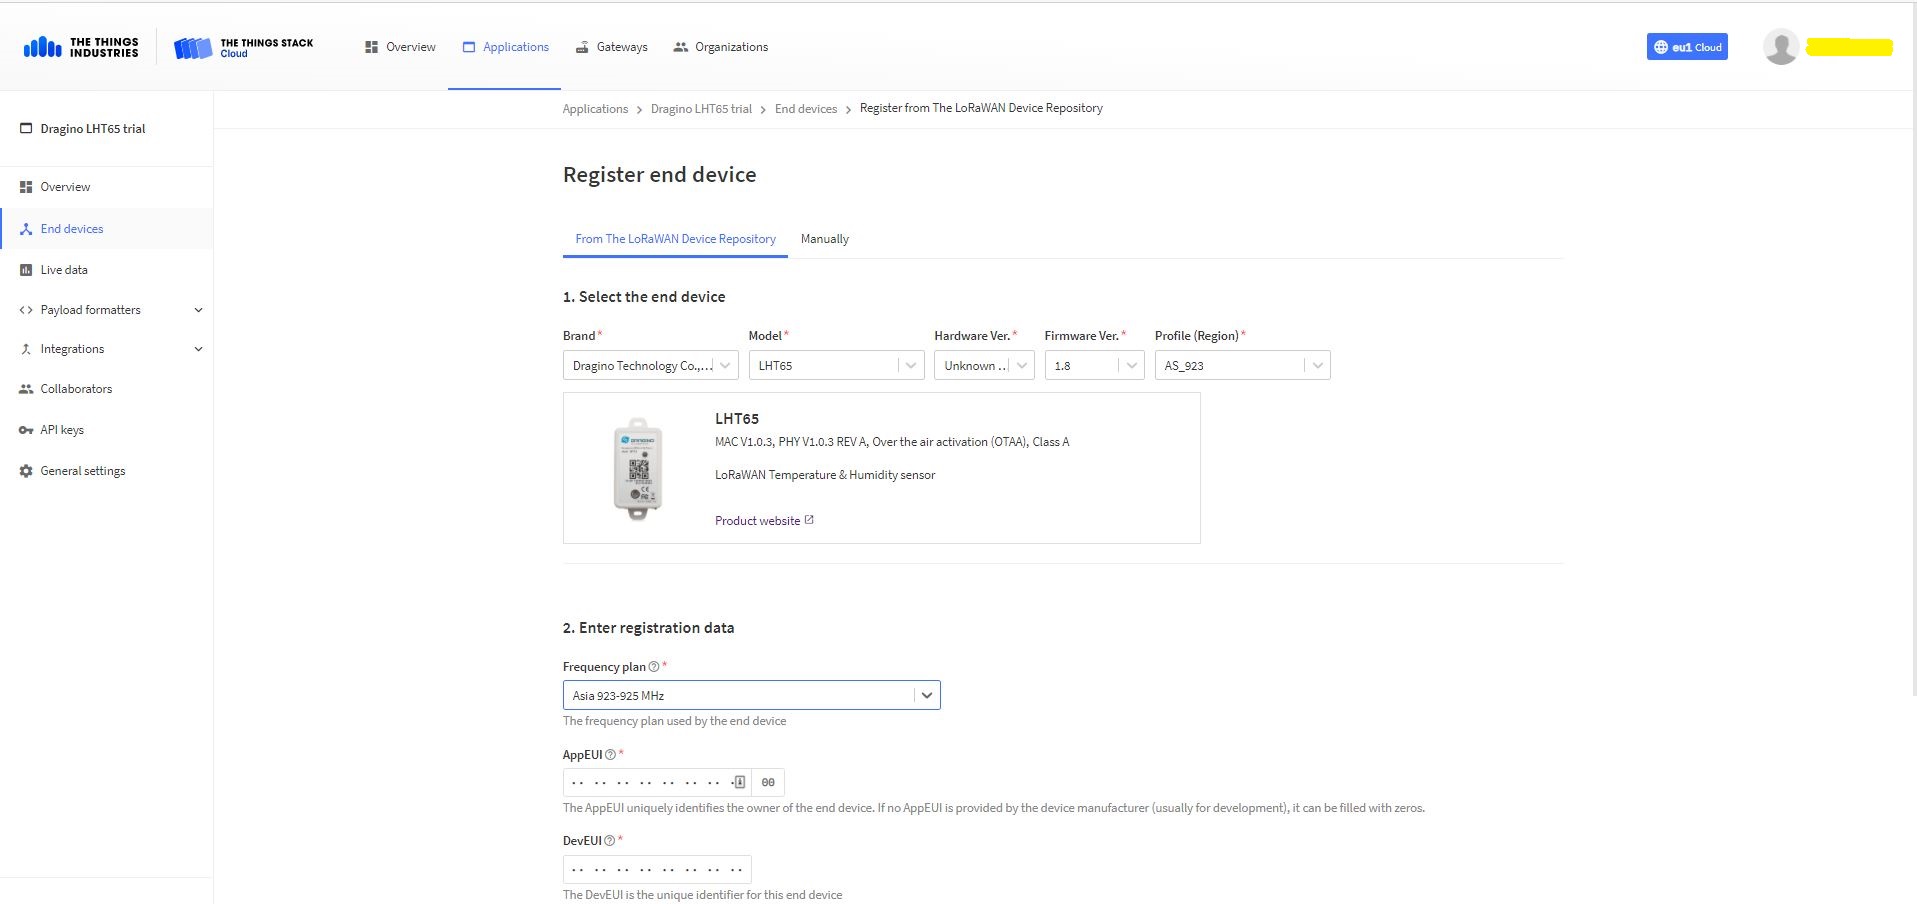
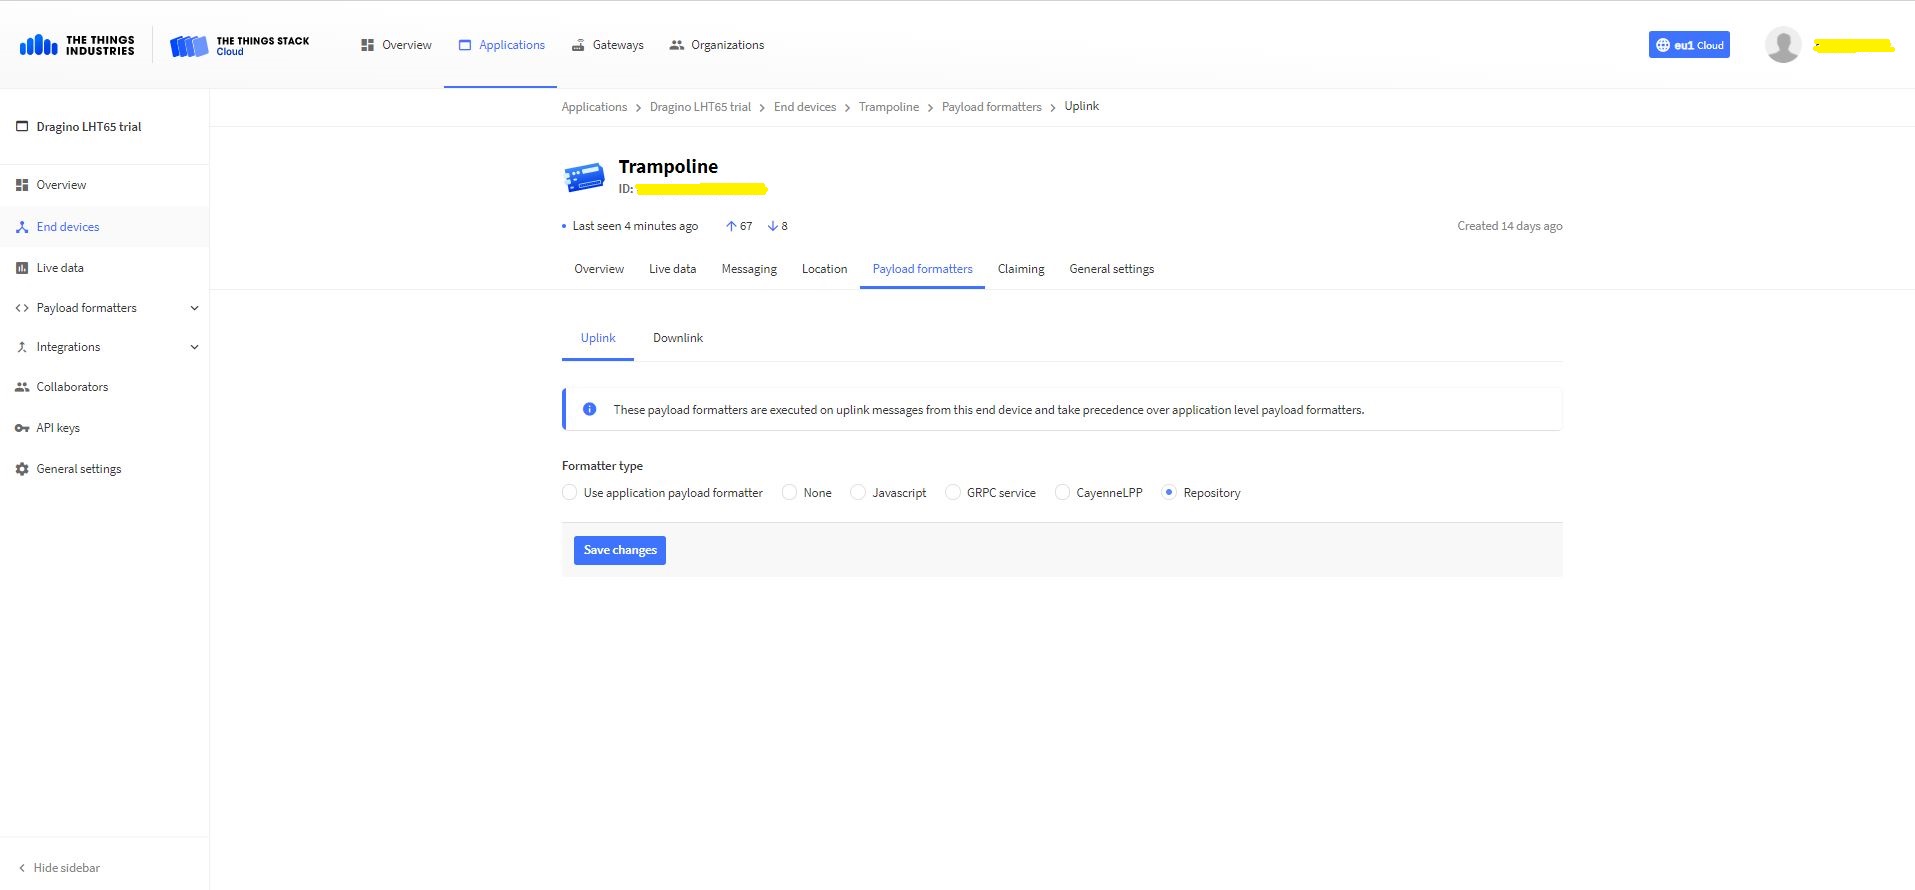
Dragino LHT 65 Device uplink payload formatter
The connector supports both uplink and downlink messages with JSON encoded payloads. The Dragino LHT65 has a vendor supplied formatter which is automatically configured when an EndDevice is created. The EndDevice formatter configuration can also be overridden at the Application level in the app.settings.json file.
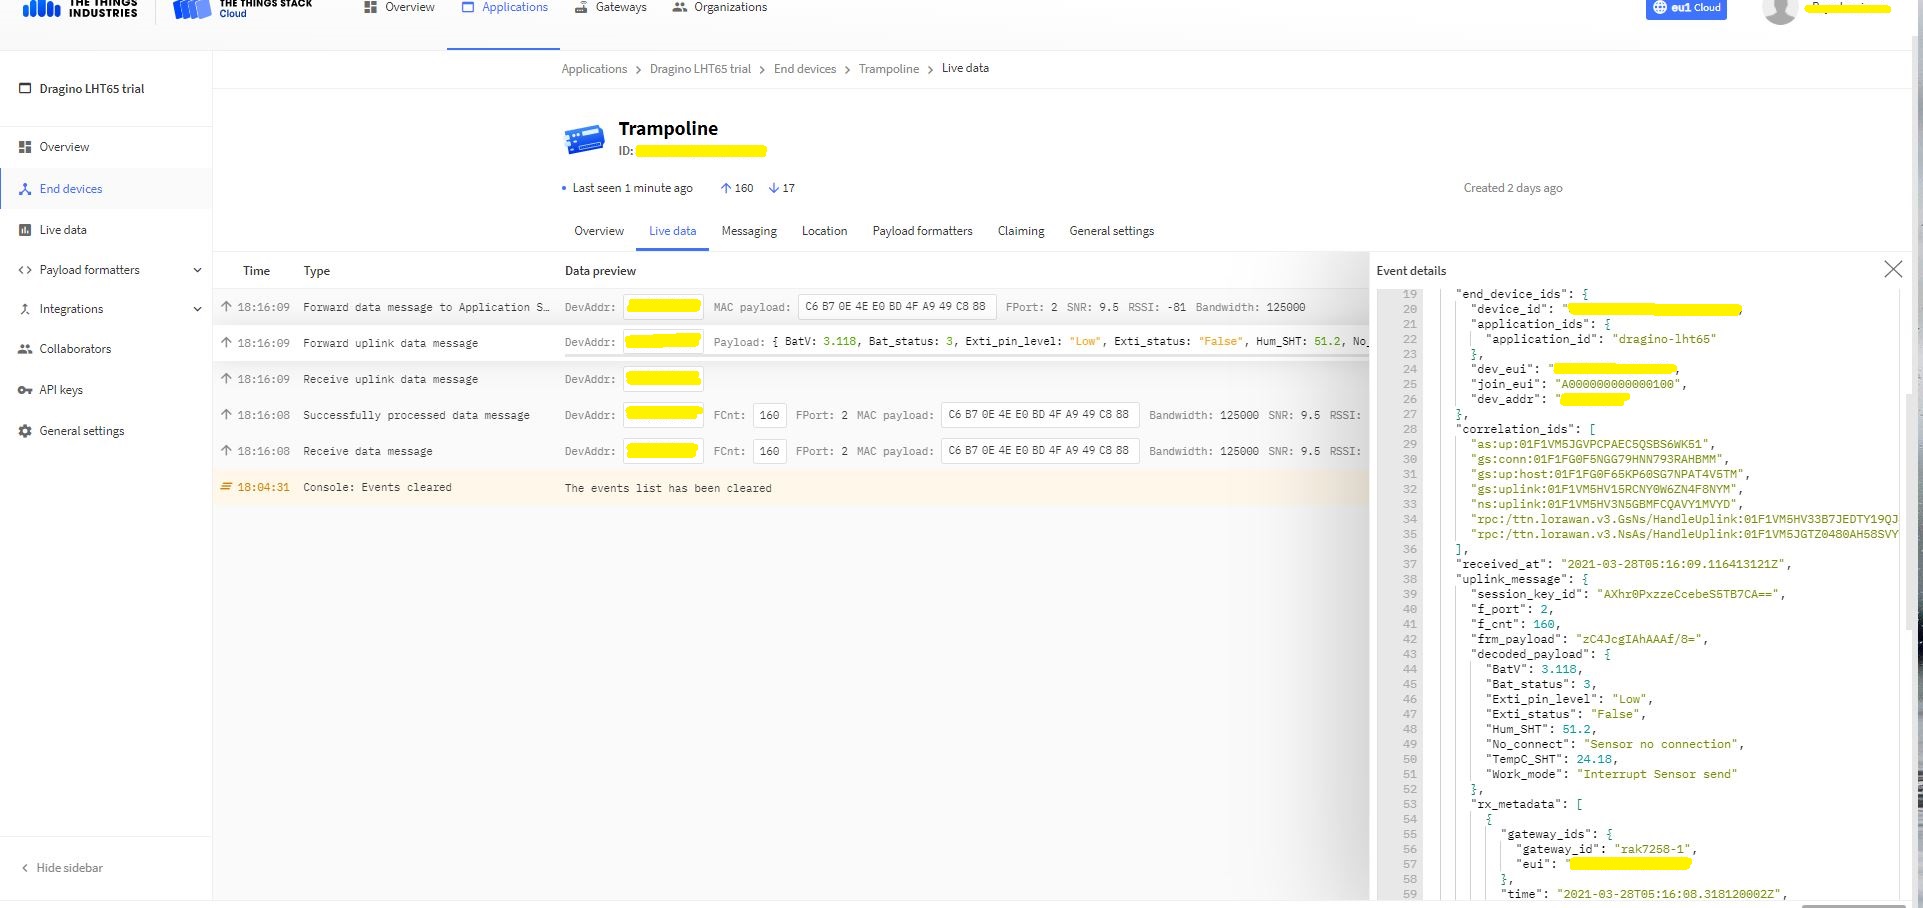
Device Live Data Uplink Data Payload
Once an EndDevice is configured in TTI/TTN I usually use the “Live data Uplink Payload” to work out the decoded payload JSON property names and data types.
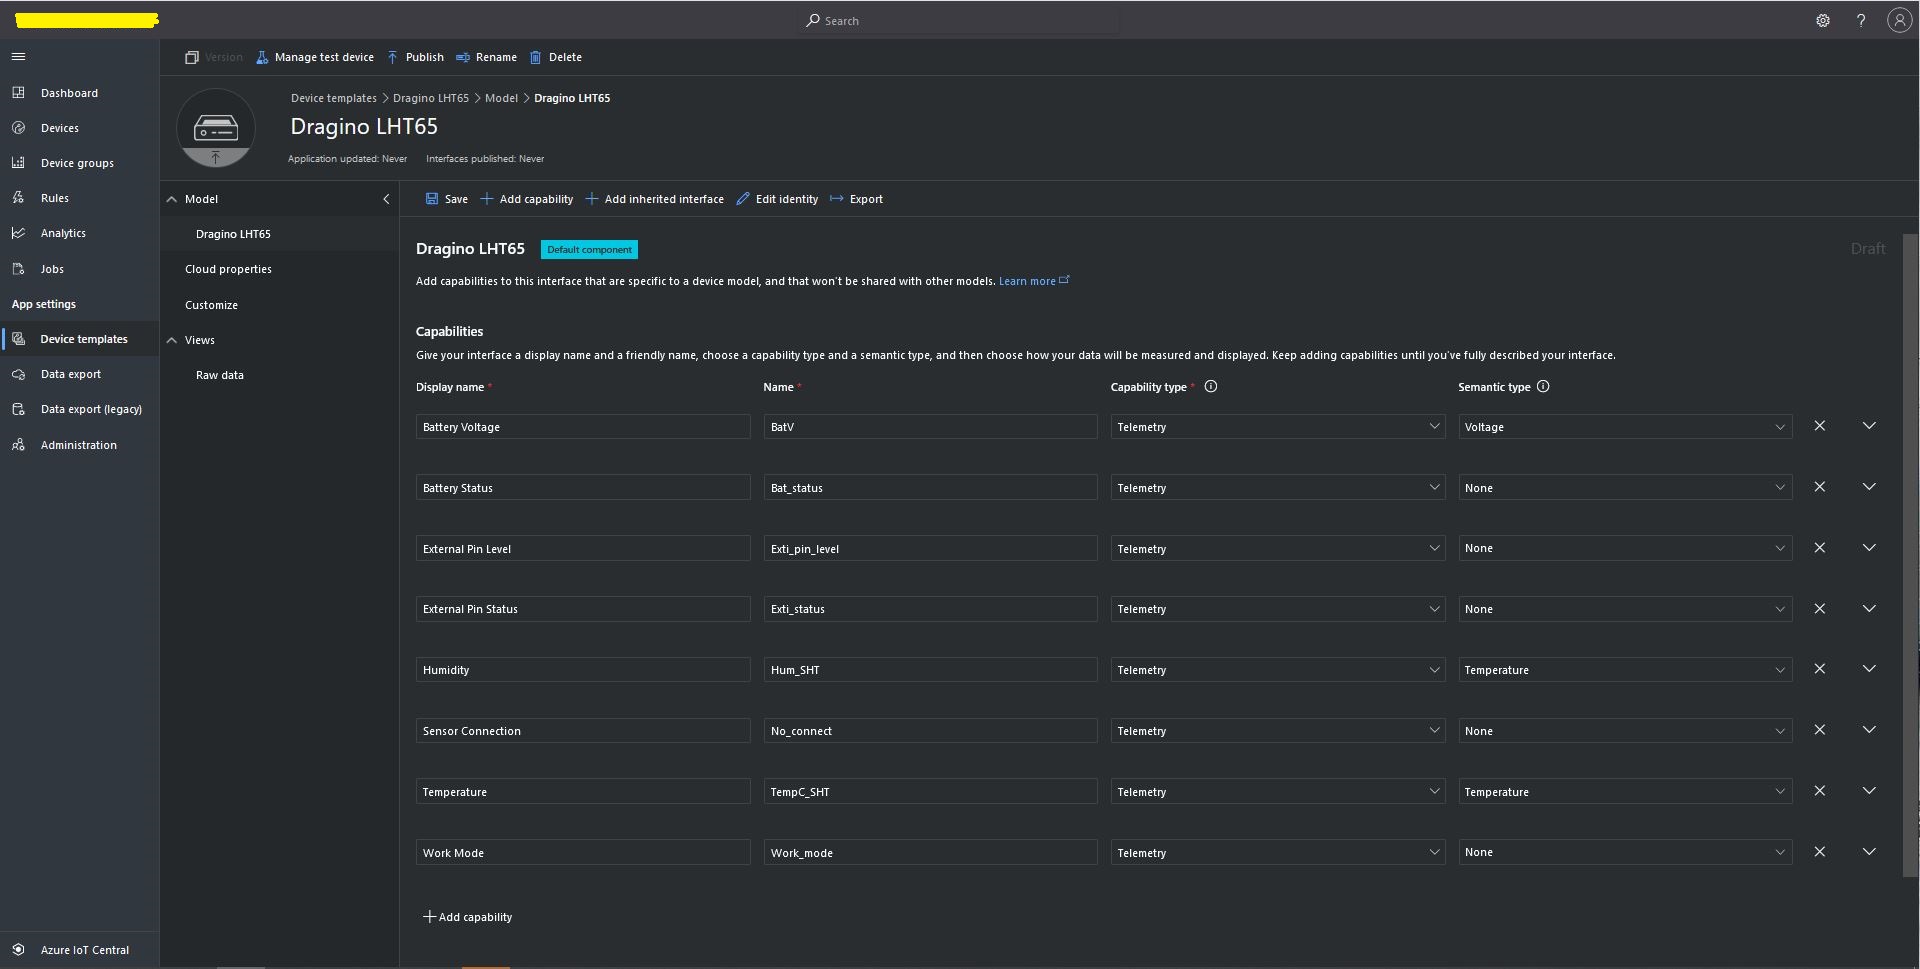
LHT65 Uplink only Azure IoT Central Device Template
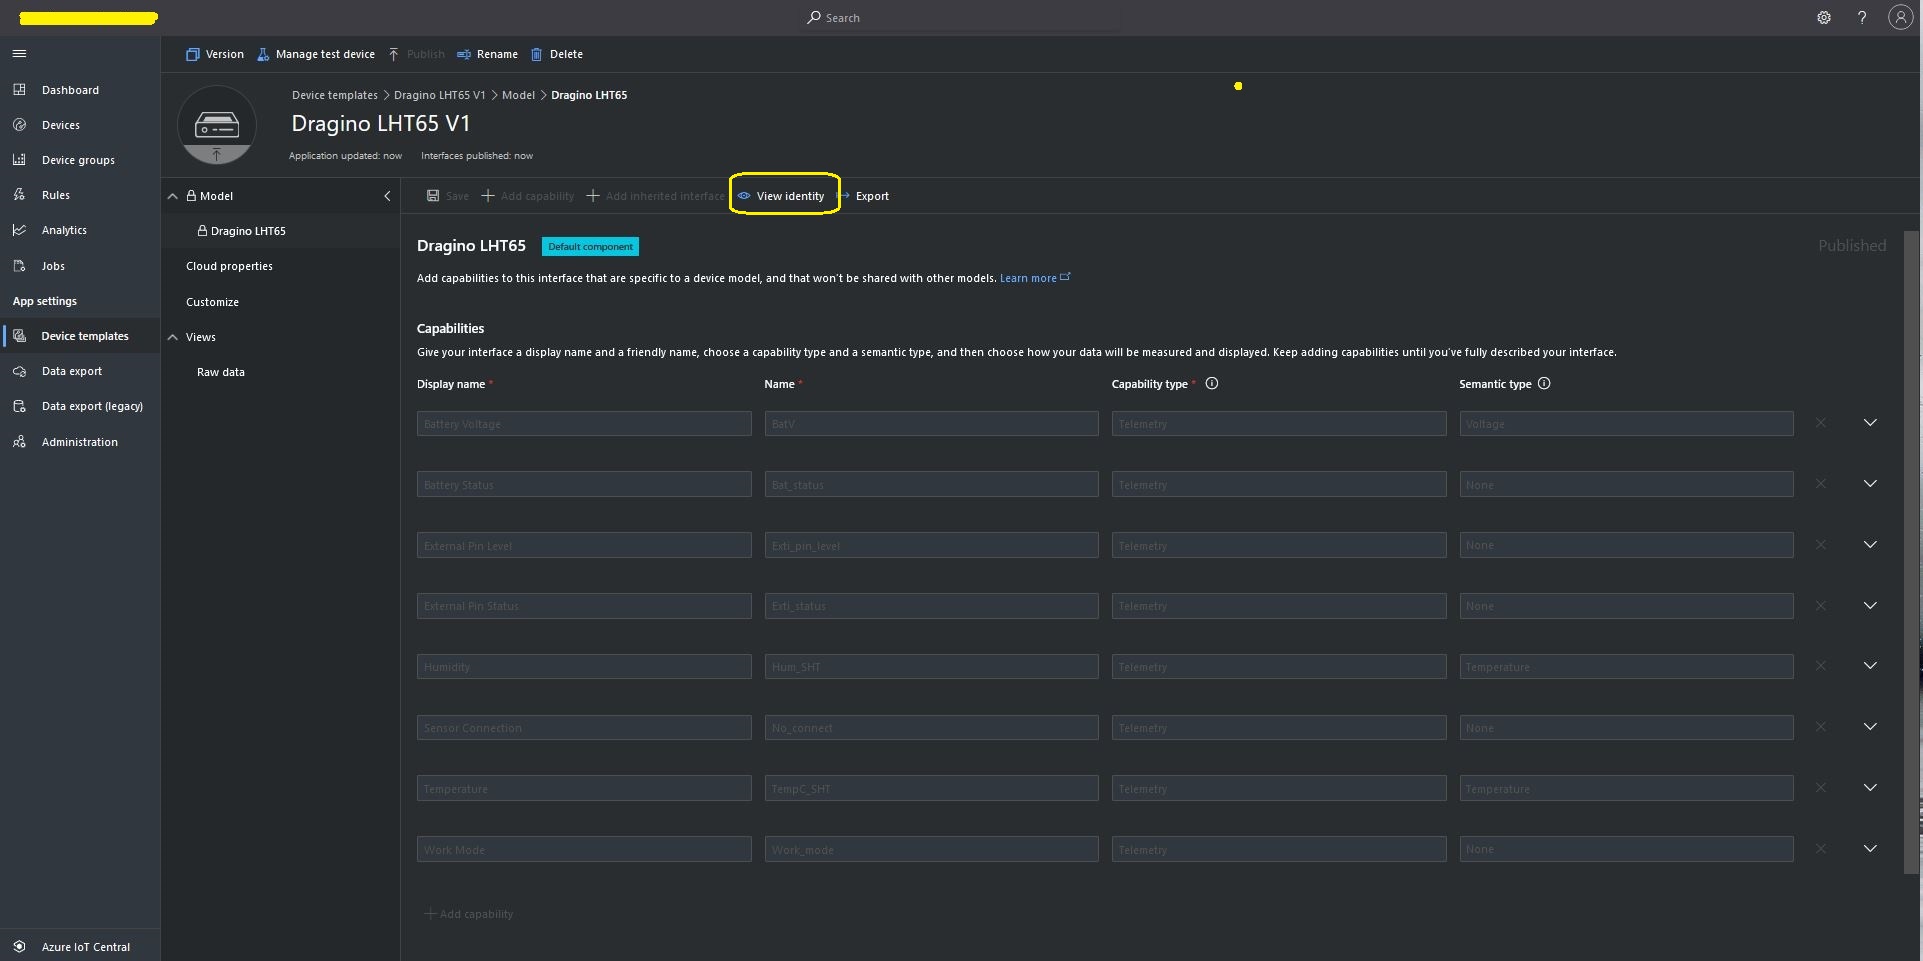
LHT65 Device Template View Identity
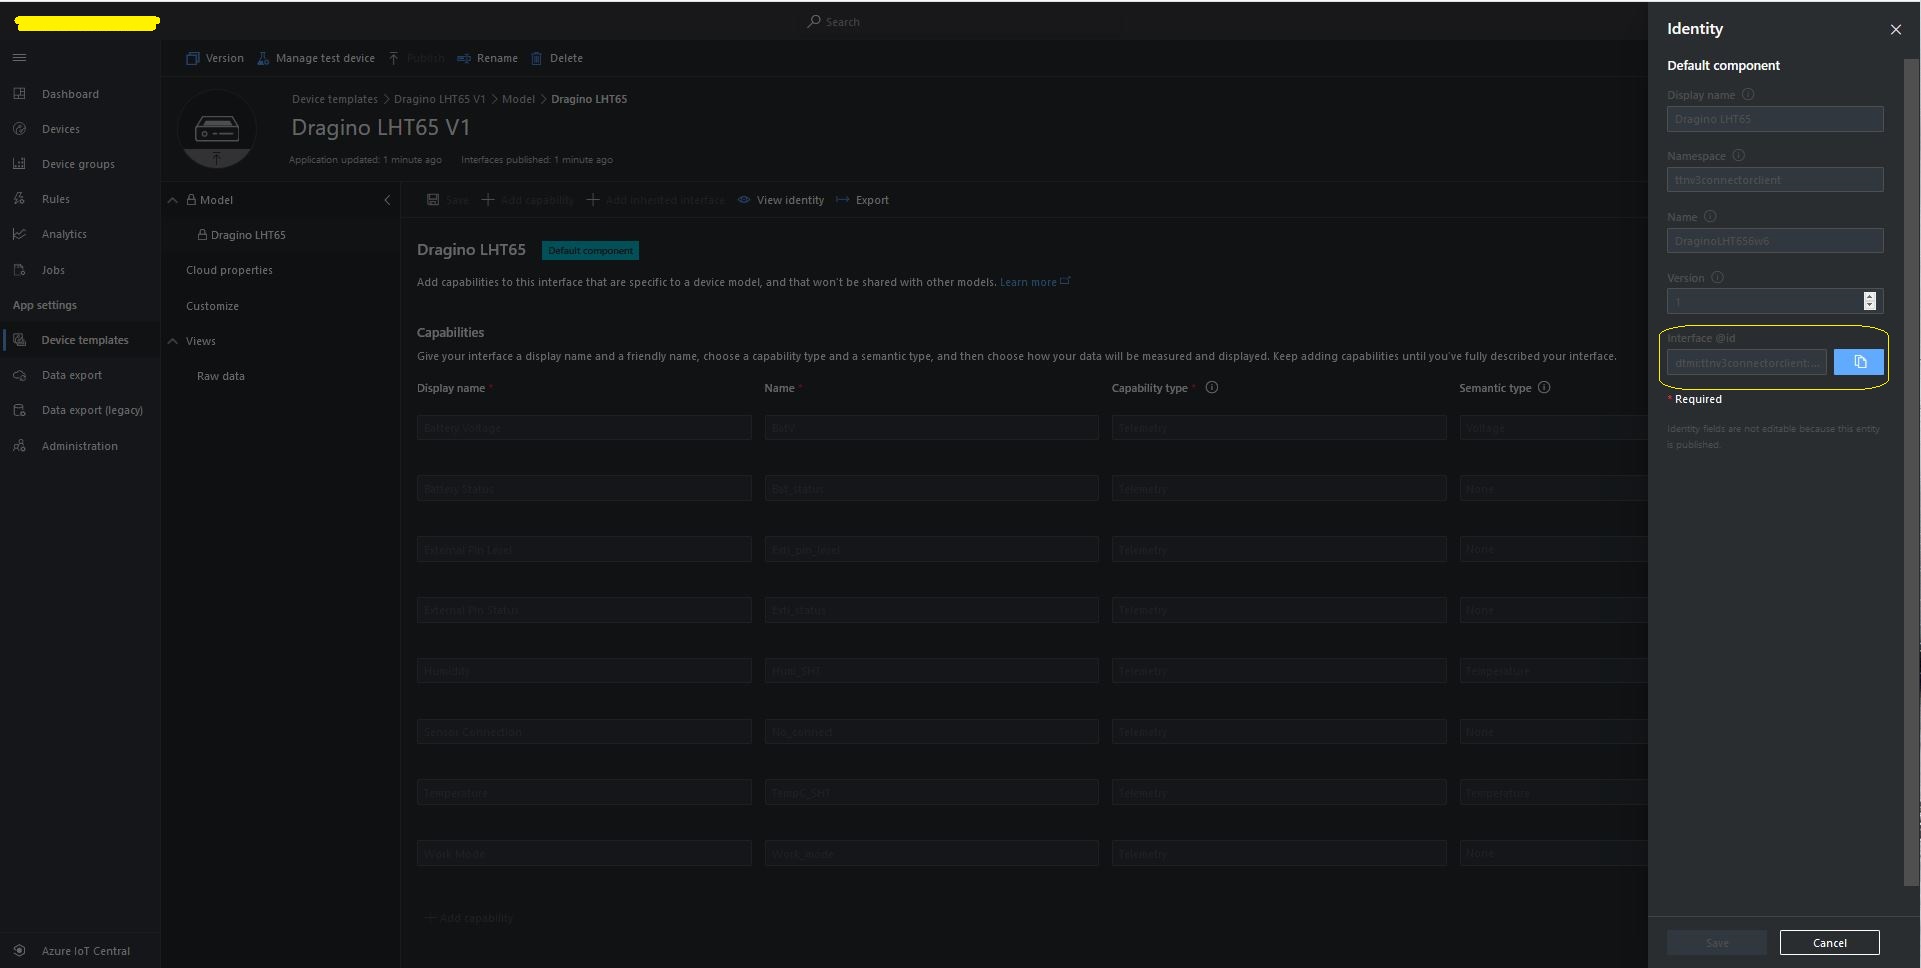
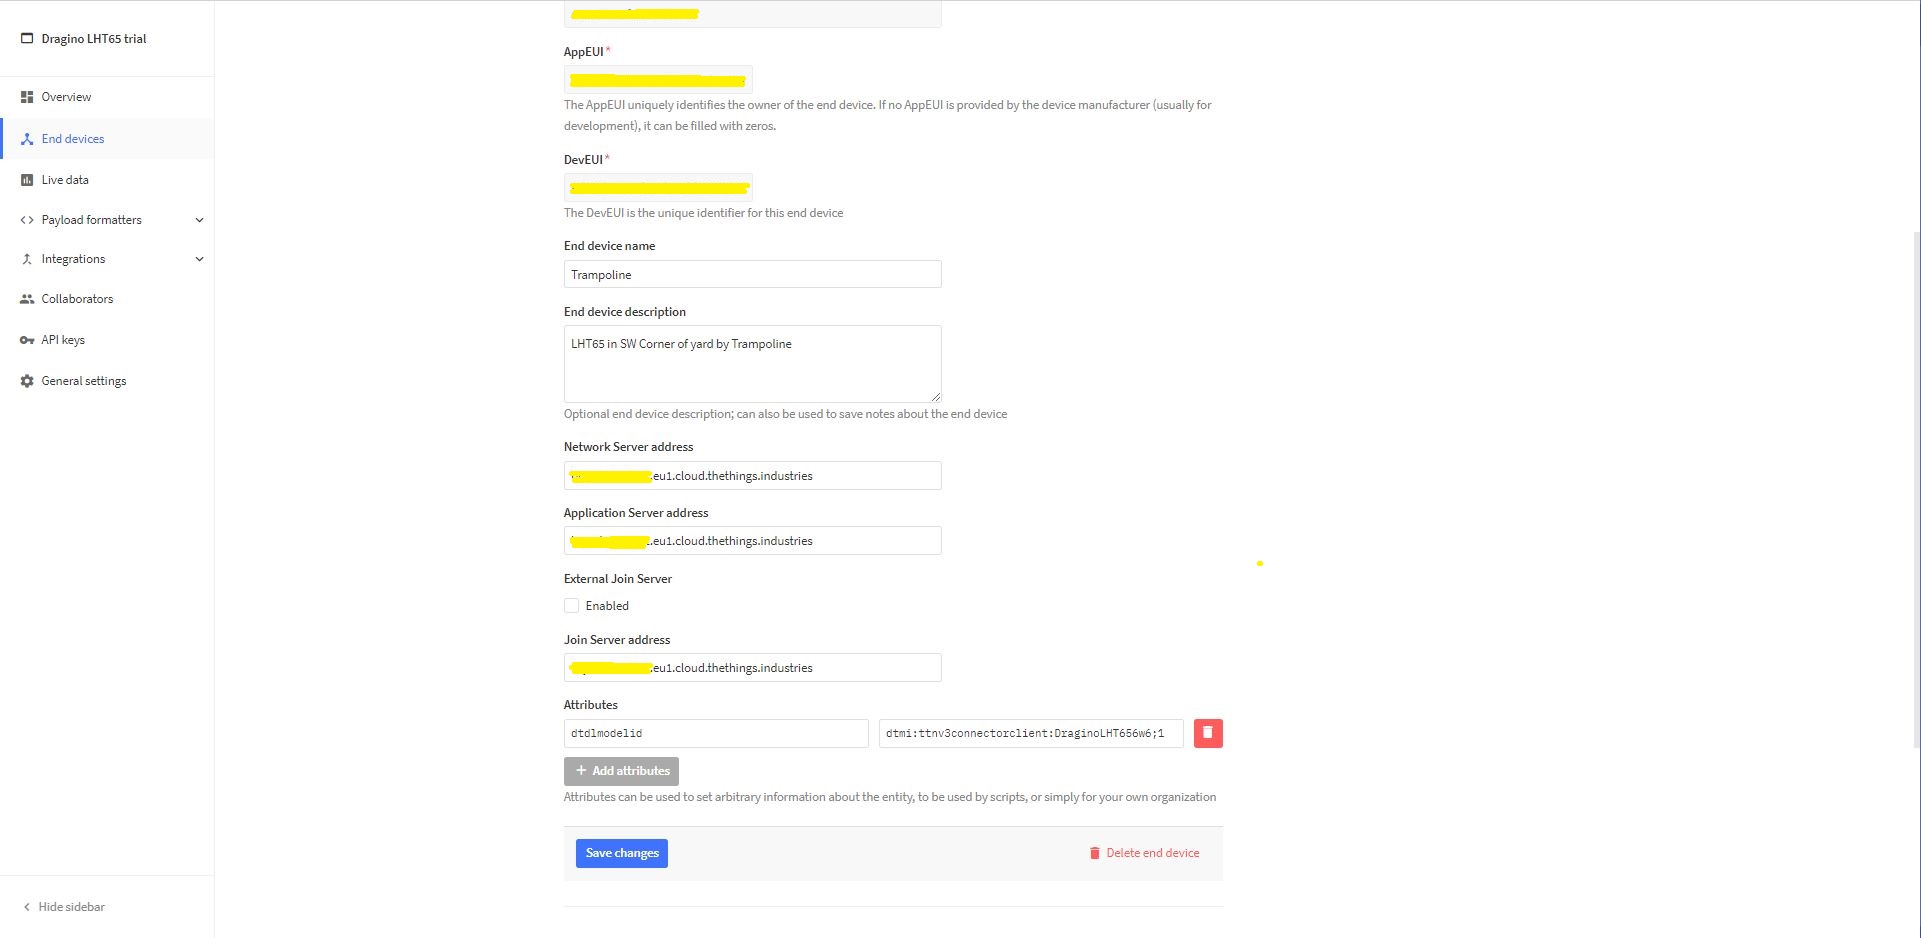
For Azure IoT Central “automagic” provisioning the DTDLModelId has to be copied from the Azure IoT Central Template into the TTI/TTN EndDevice or app.settings.json file application configuration.
LHT65 Device Template copy DTDL @ID
TTI EndDevice configuring the DTDLV2 @ID at the device level
Configuring the DTDLV2 @ID at the TTI application level in the app.settings.json file
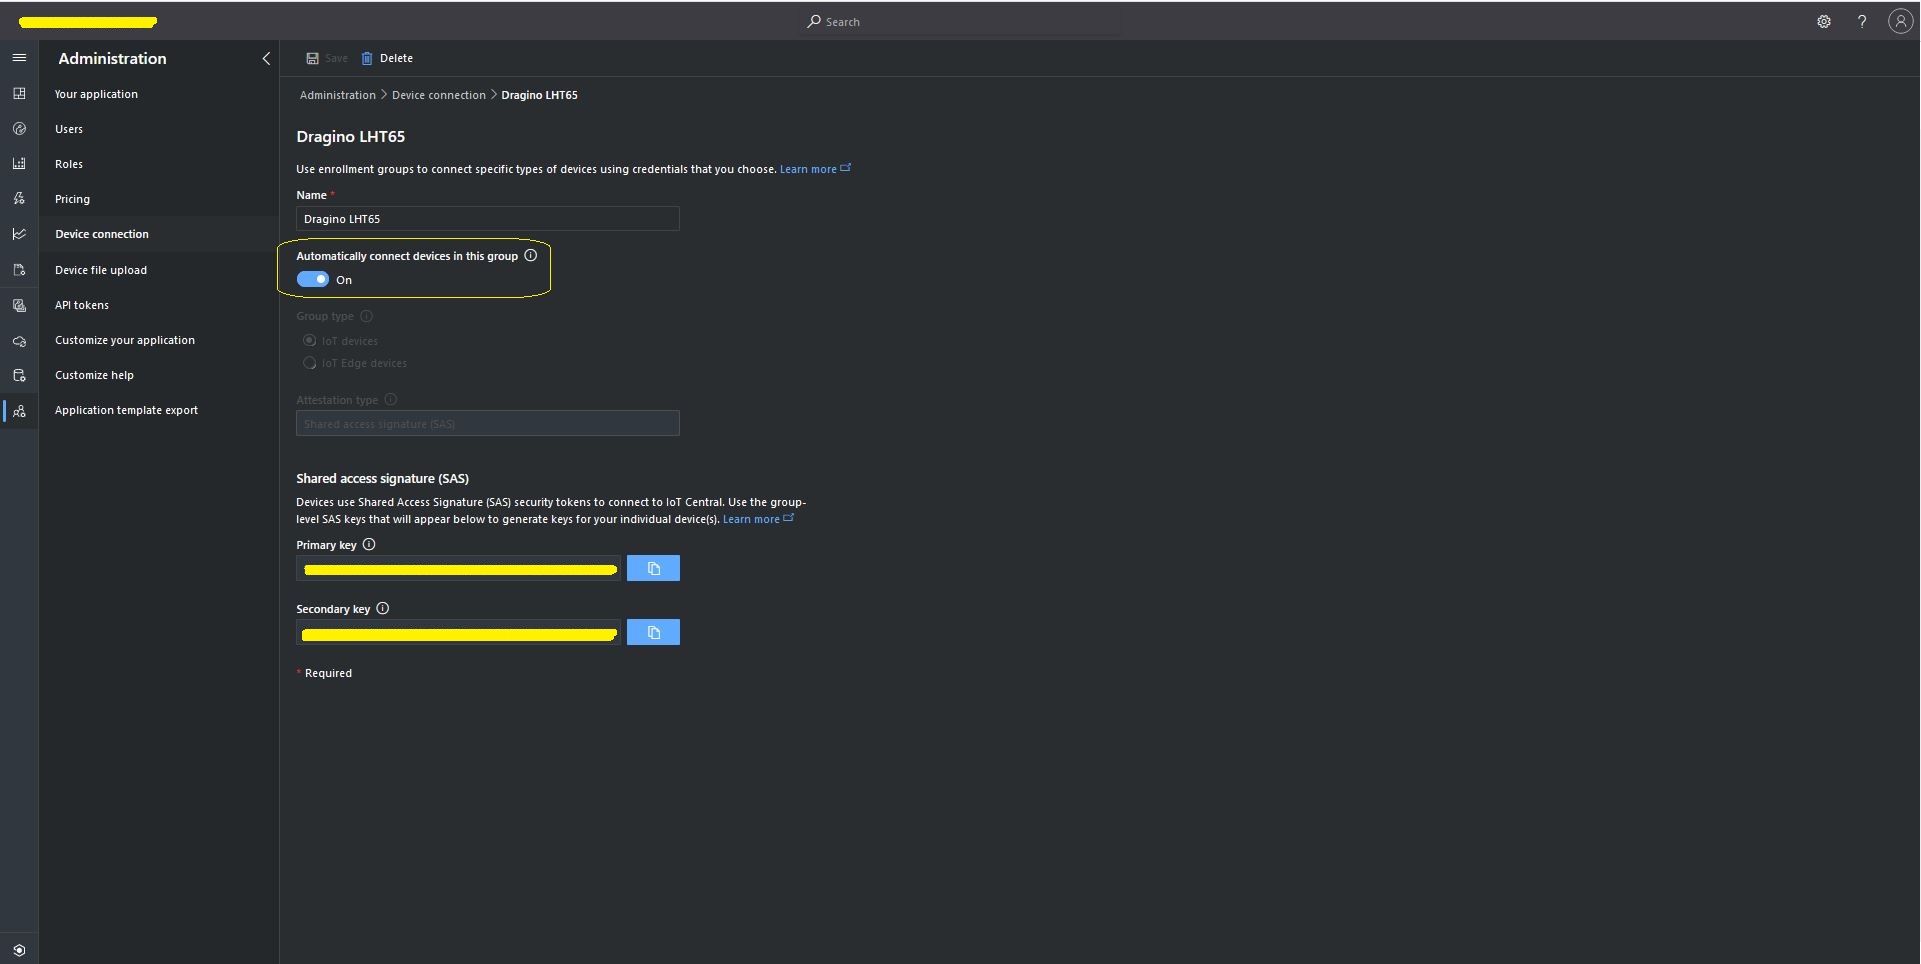
The Azure Device Provisioning Service(DPS) is configured at the TTI application level in the app.settings.json file. The IDScope and one of the Primary or Secondary Shared Access Signature(SAS) keys should be copied into DeviceProvisioningServiceSettings of an Application in the app.settings.json file. I usually set the “Automatically connect devices in this group” flag as part of the “automagic” provisioning process.
Azure IoT Central Group Enrollment Key
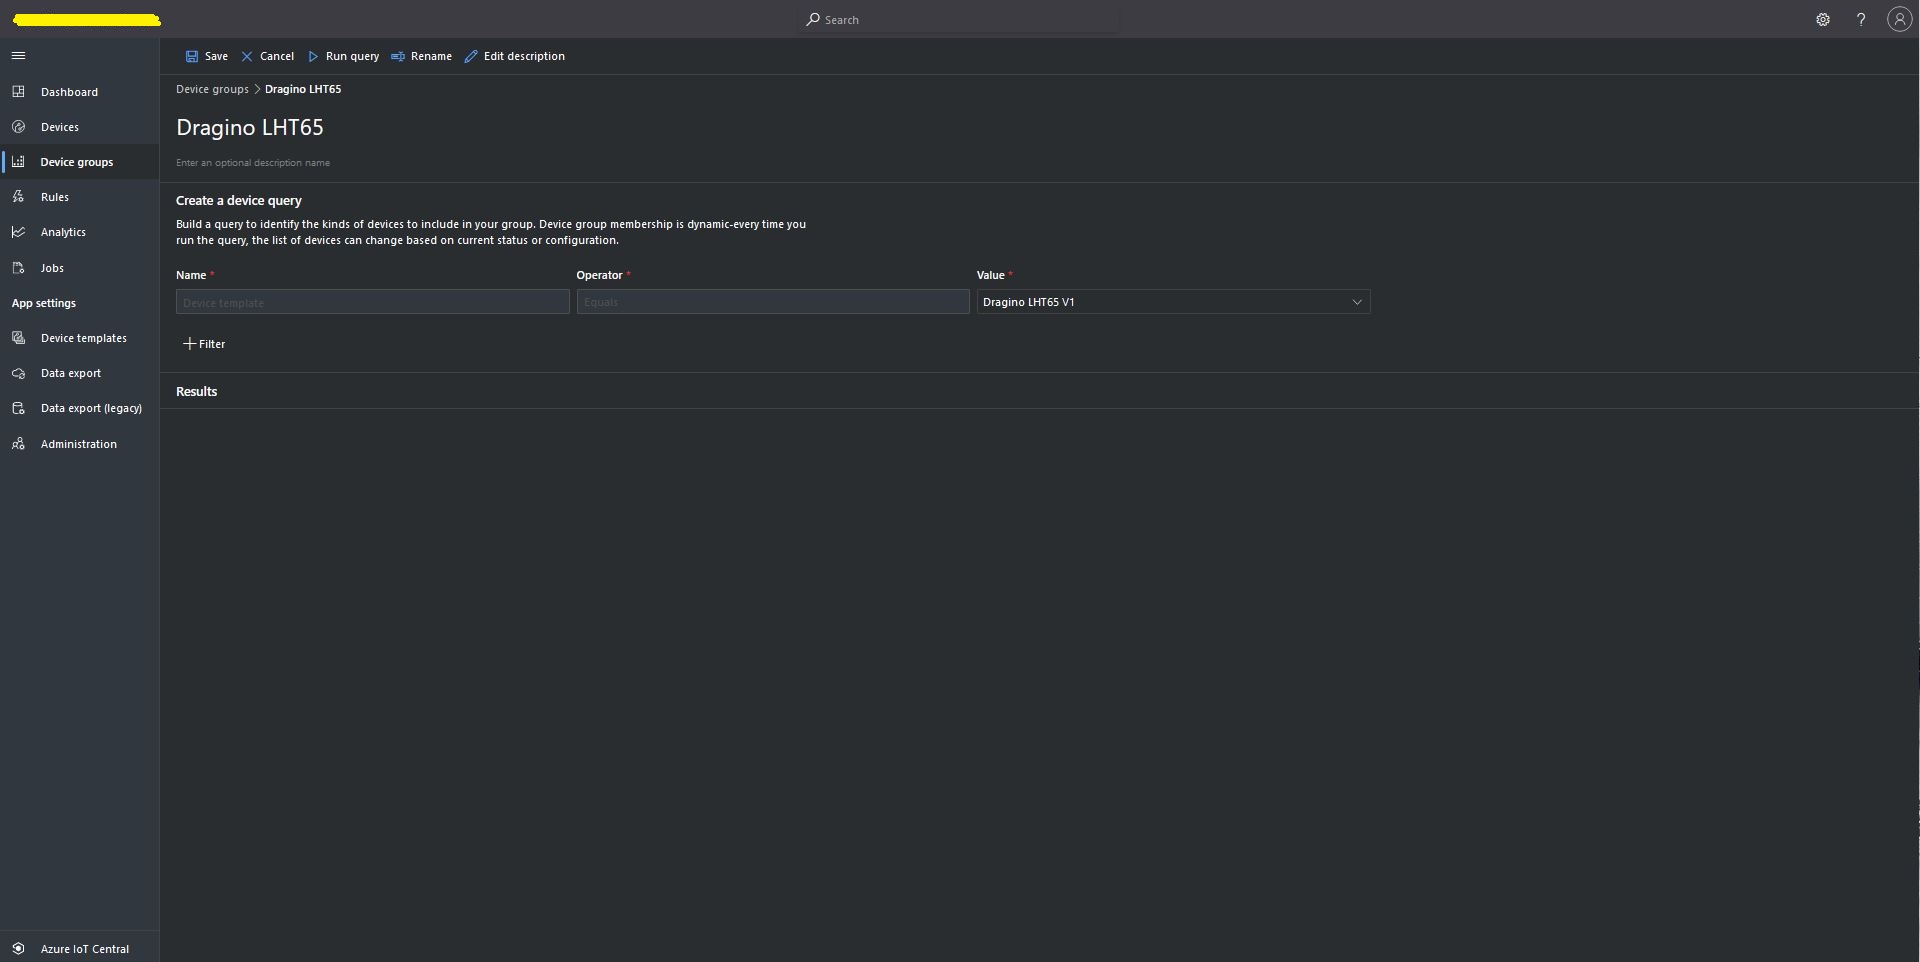
Then device templates need to be mapped to an Enrollment Group then Device Group.
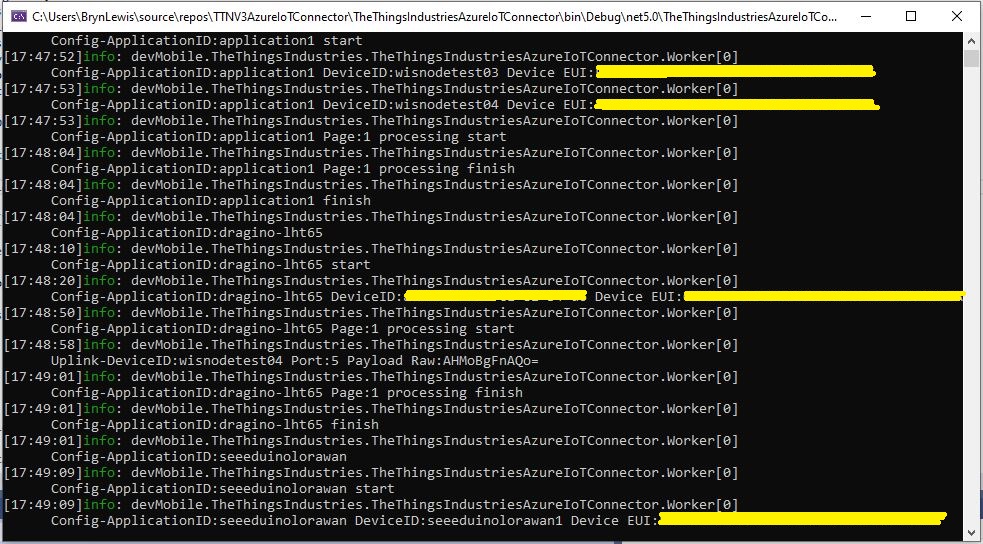
For testing the connector application can be run locally with diagnostic information displayed in the application console window as it “automagically’ provisions devices and uploads telemetry data.
Connector application Diagnostics
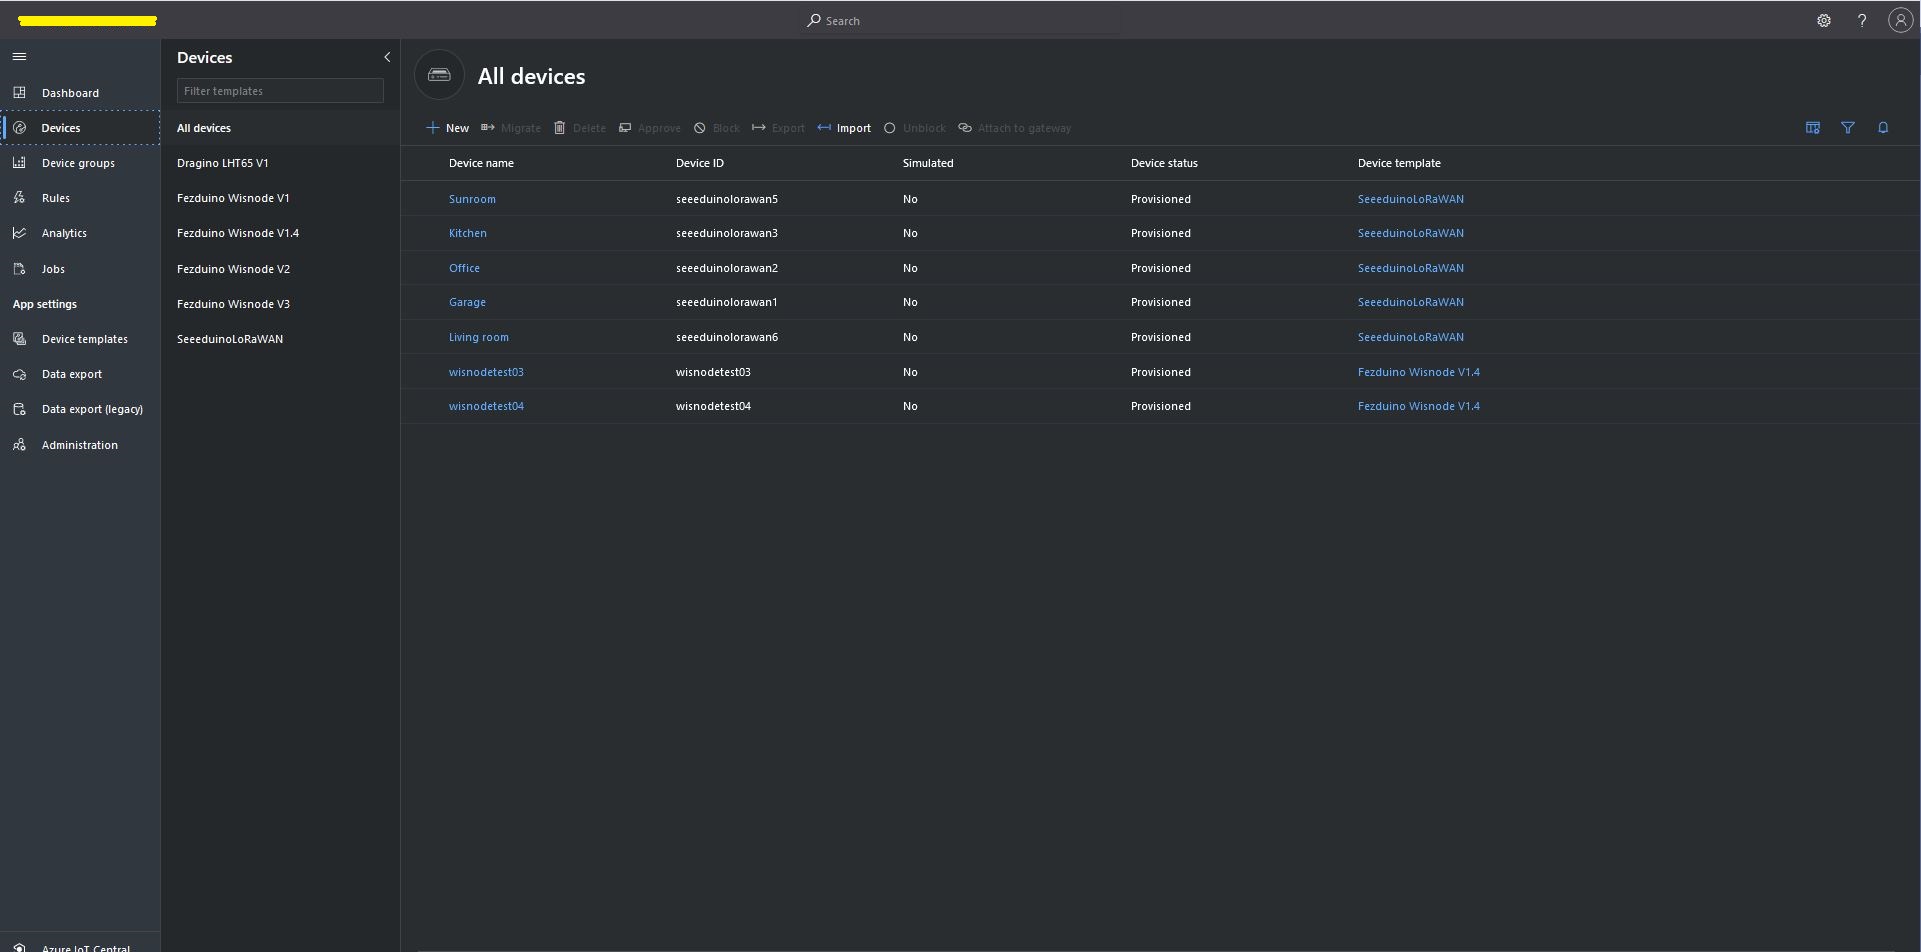
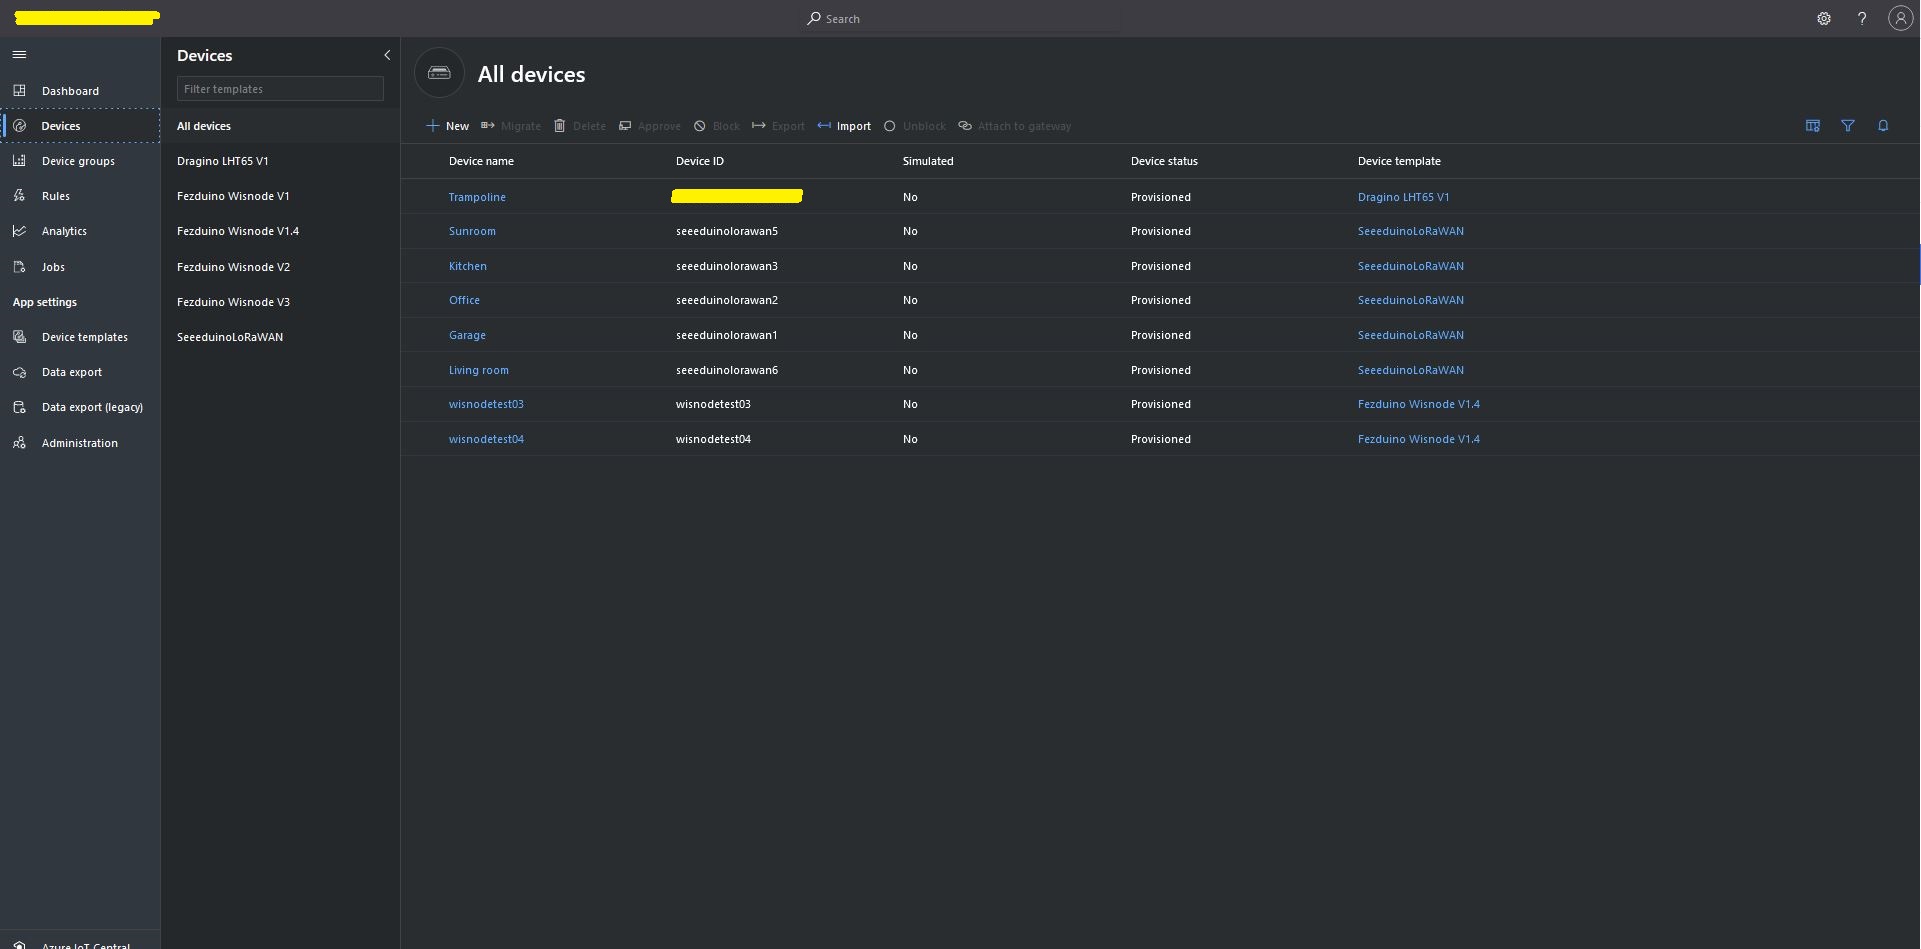
Azure IoT Central Device list before my LHT65 device is “automagically” provisioned
Azure IoT Central Device list after my LHT65 device is “automagically” provisioned
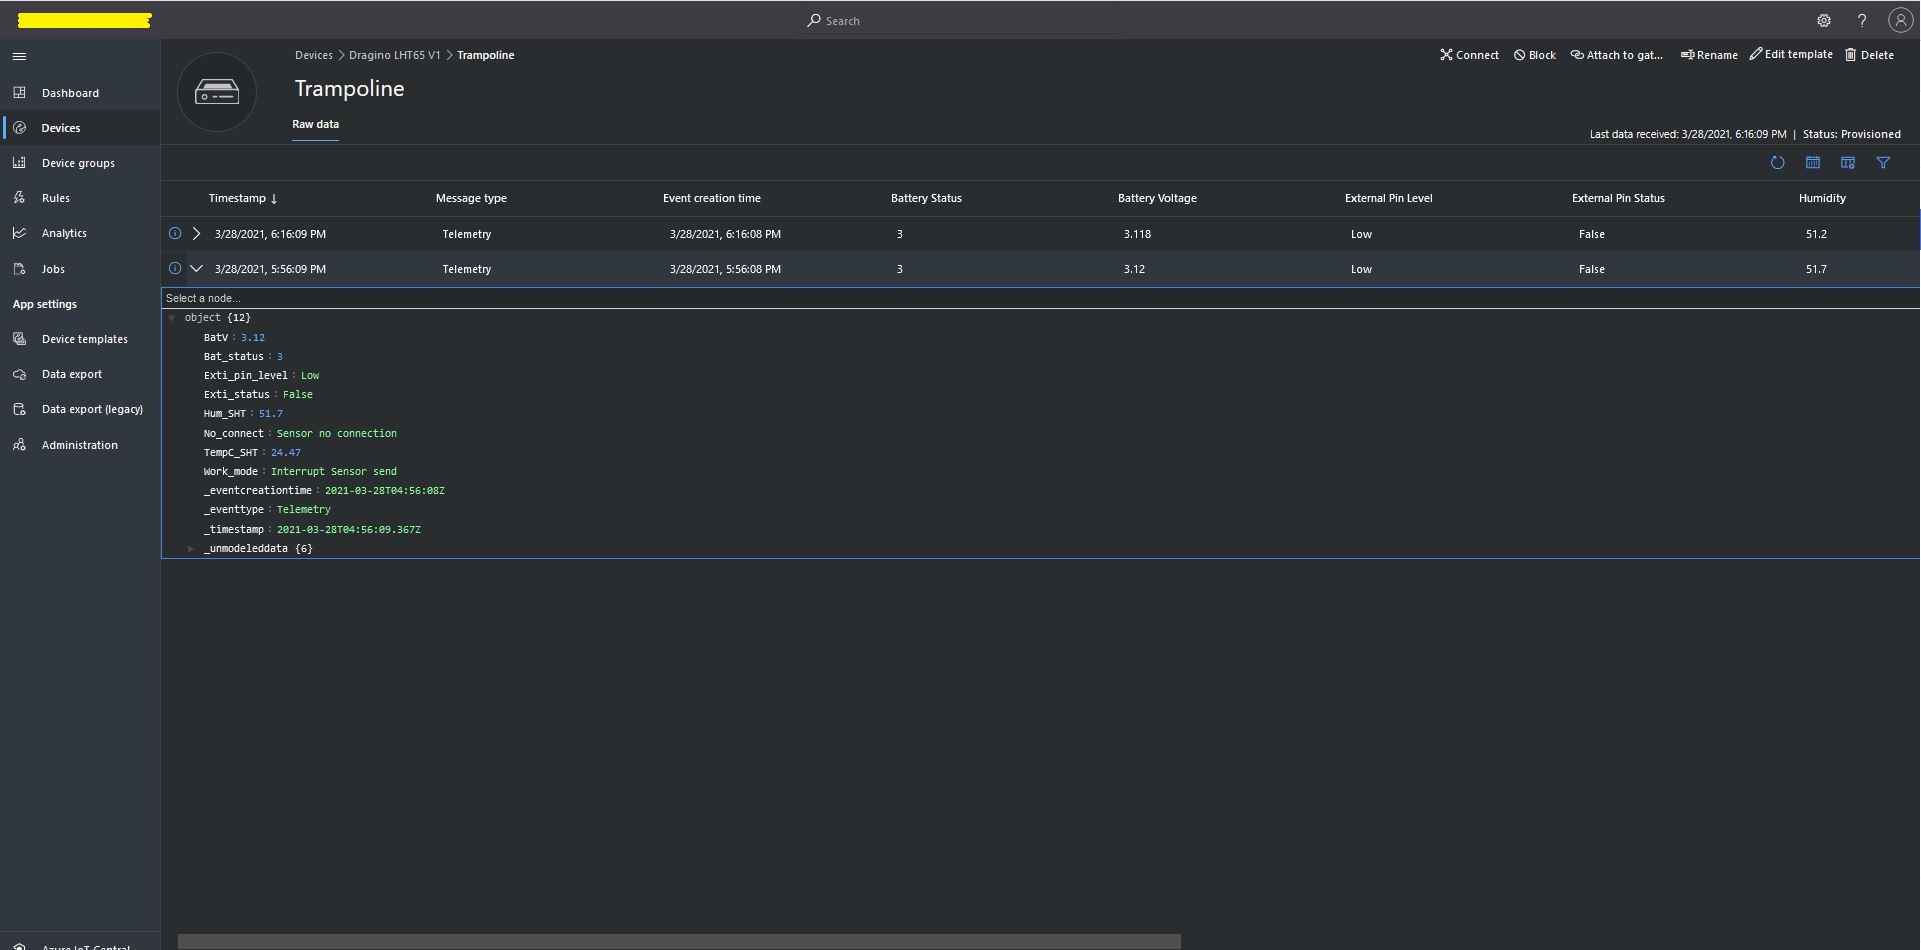
One a device has been provisioned I check on the raw data display that all the fields I configured have been mapped correctly.
Azure IoT Central raw data display
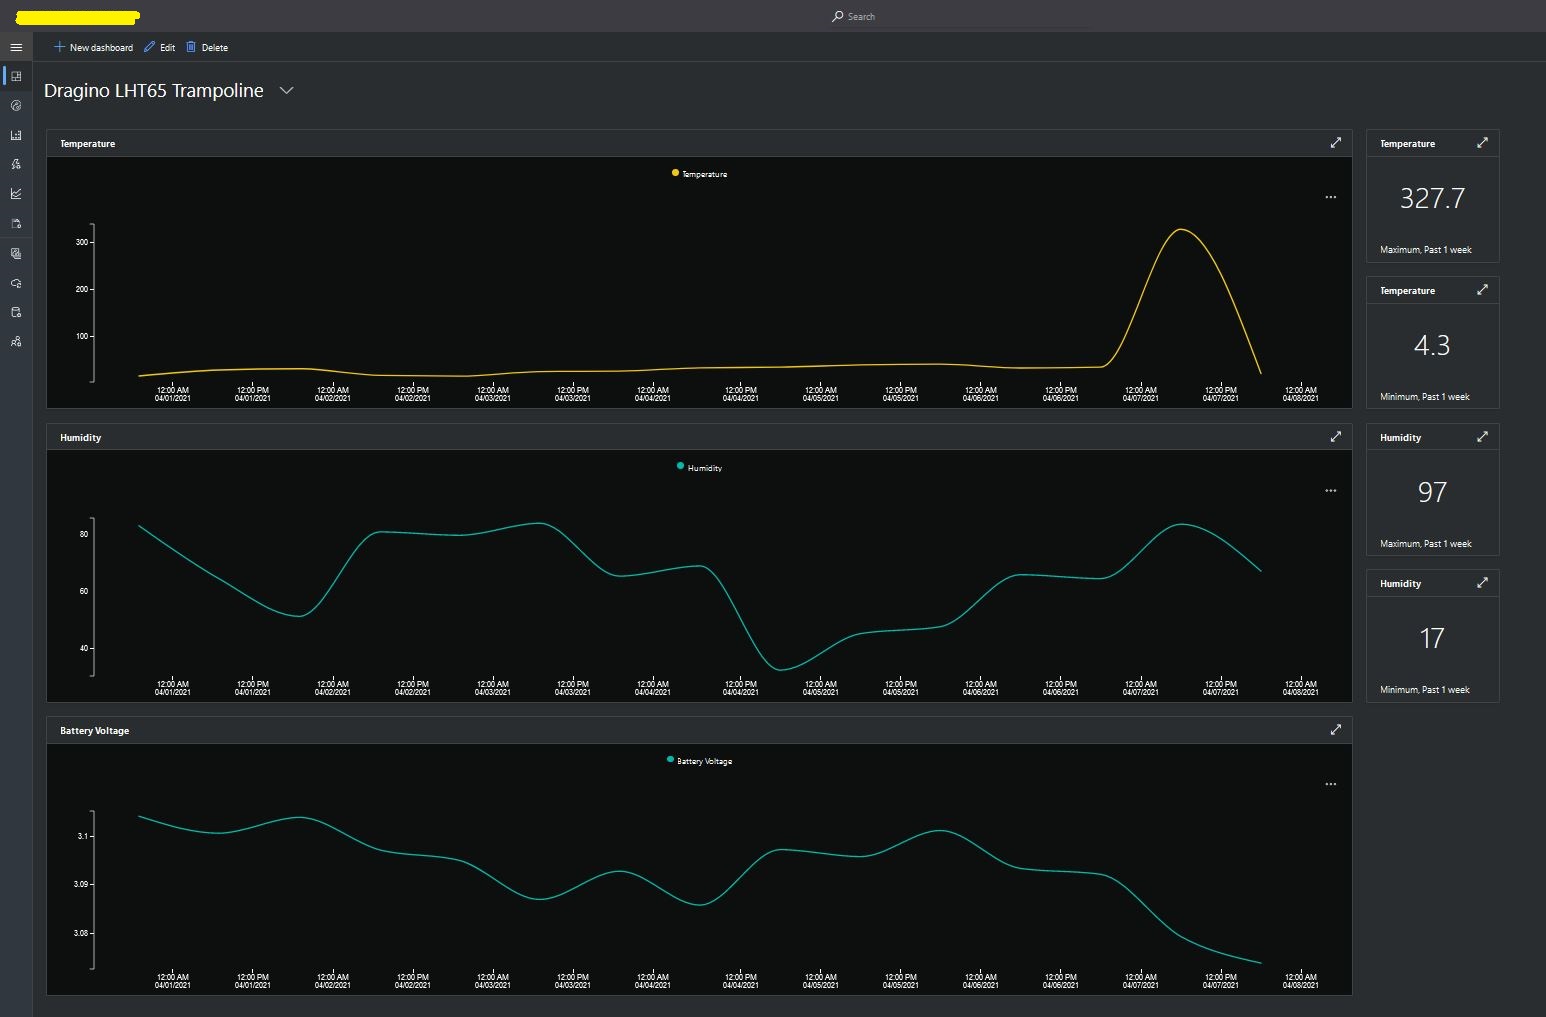
I then created a dashboard to display the telemetry data from the LHT65 sensors.
Azure IoT Central dashboard displaying LHT65 temperature, humidity and battery voltage graphs.
The dashboard also has a few KPI displays which highlighted an issue which occurs a couple of times a month with the LHT65 onboard temperature sensor values (327.7°). I have connected Dragino technical support and have also been unable to find a way to remove the current an/or filter out future aberrant values.
Azure Application Insights logging
I also noticed that the formatting of the DeviceEUI values in the Application Insights logging was incorrect after trying to search for one of my Seeedstudio LoRaWAN device with its DeviceEUI.