Random wanderings through Microsoft Azure esp. PaaS plumbing, the IoT bits, AI on Micro controllers, AI on Edge Devices, .NET nanoFramework, .NET Core on *nix and ML.NET+ONNX
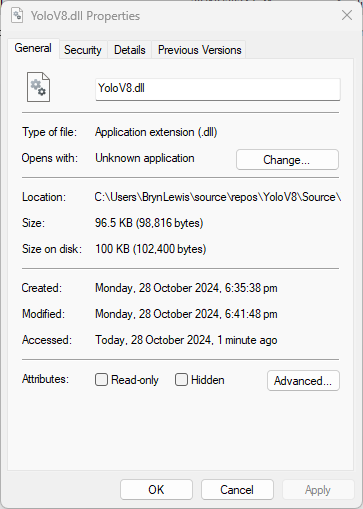
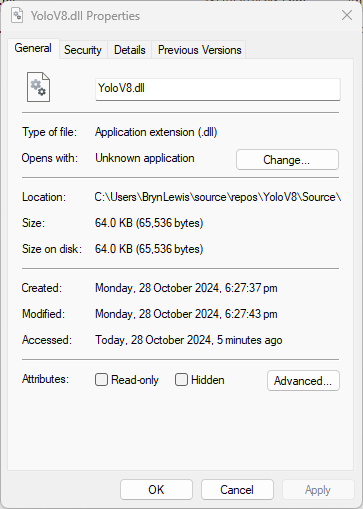
The initial version of the YoloV8.dll in the version 4.2 of the NuGet was 96.5KB. Most of my applications deployed to edge devices and Azure do not require plotting functionality so I started by commenting out (not terribly subtle).
When in high power mode more cores are used but this consumes more resource when building the ONNXRuntime. To limit resource utilisation --parallel2 was added the command line because the compile process was having “out of memory” failures.
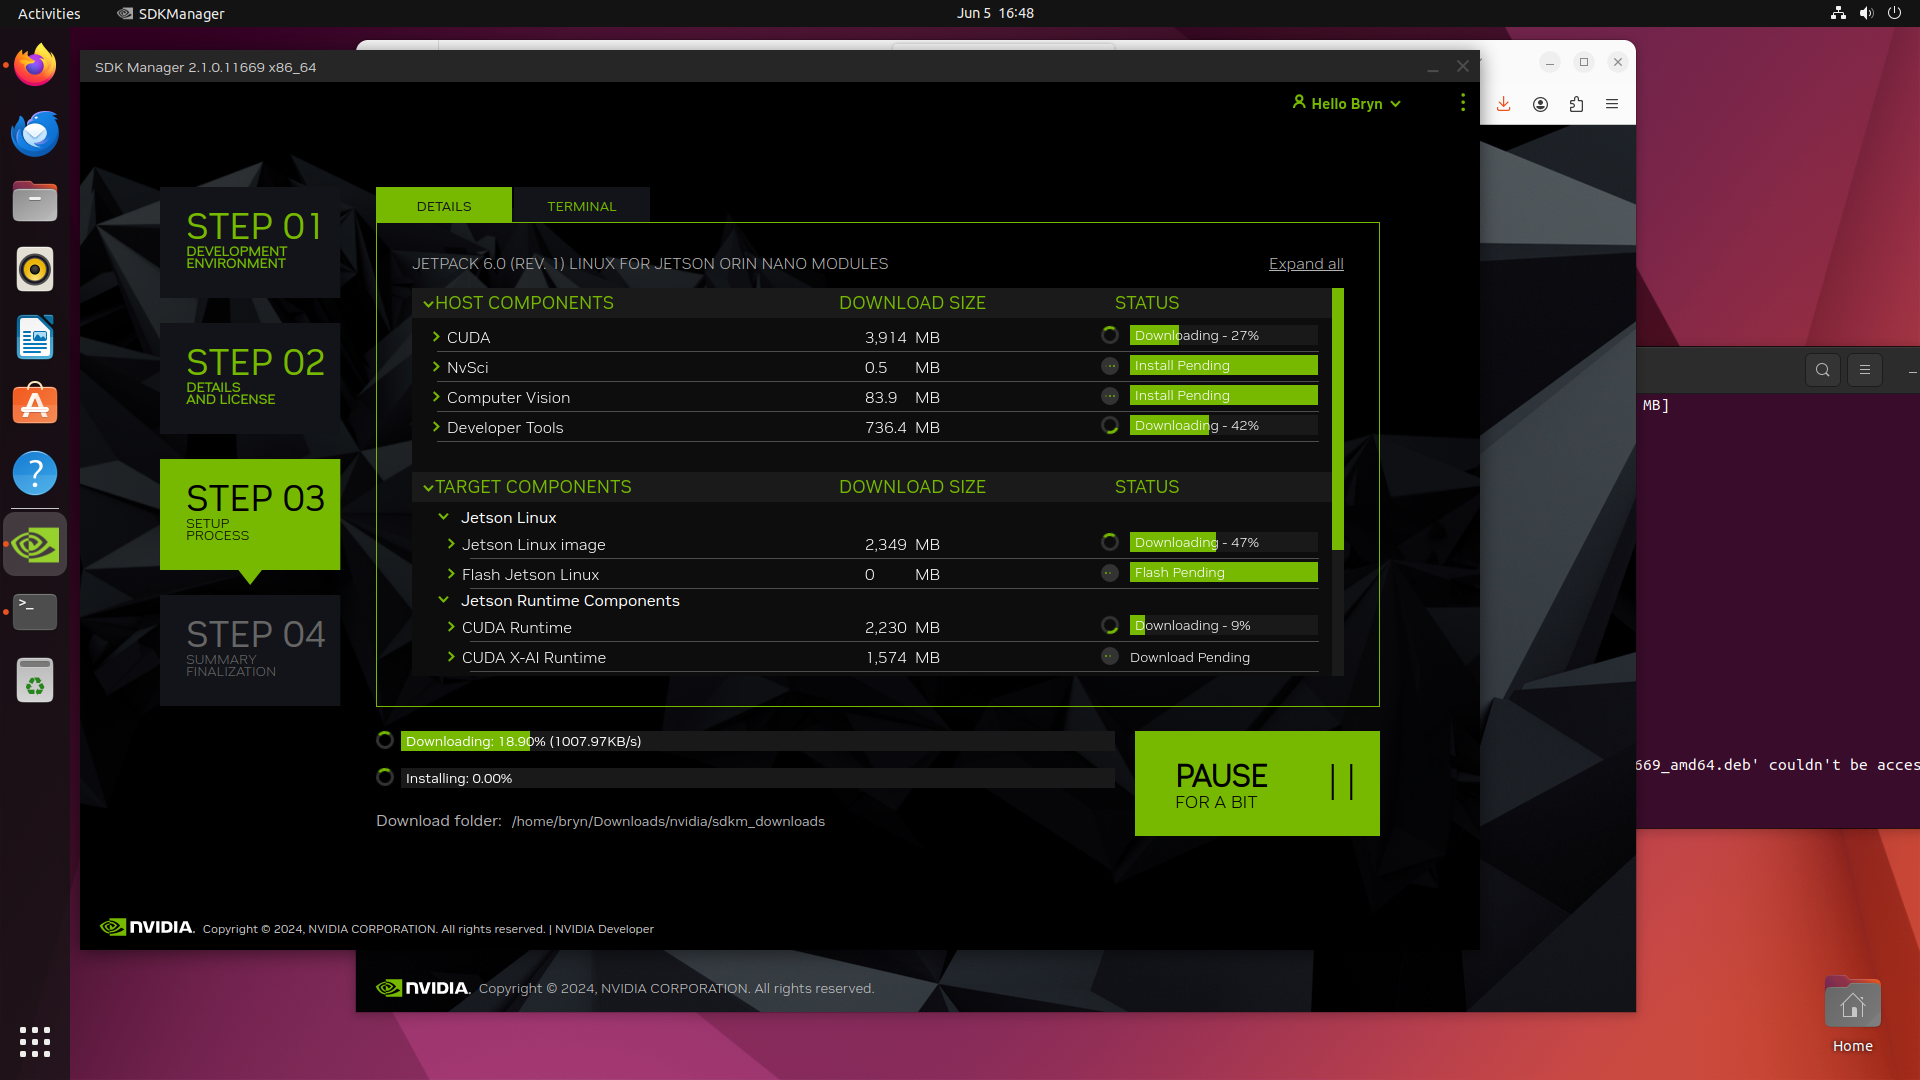
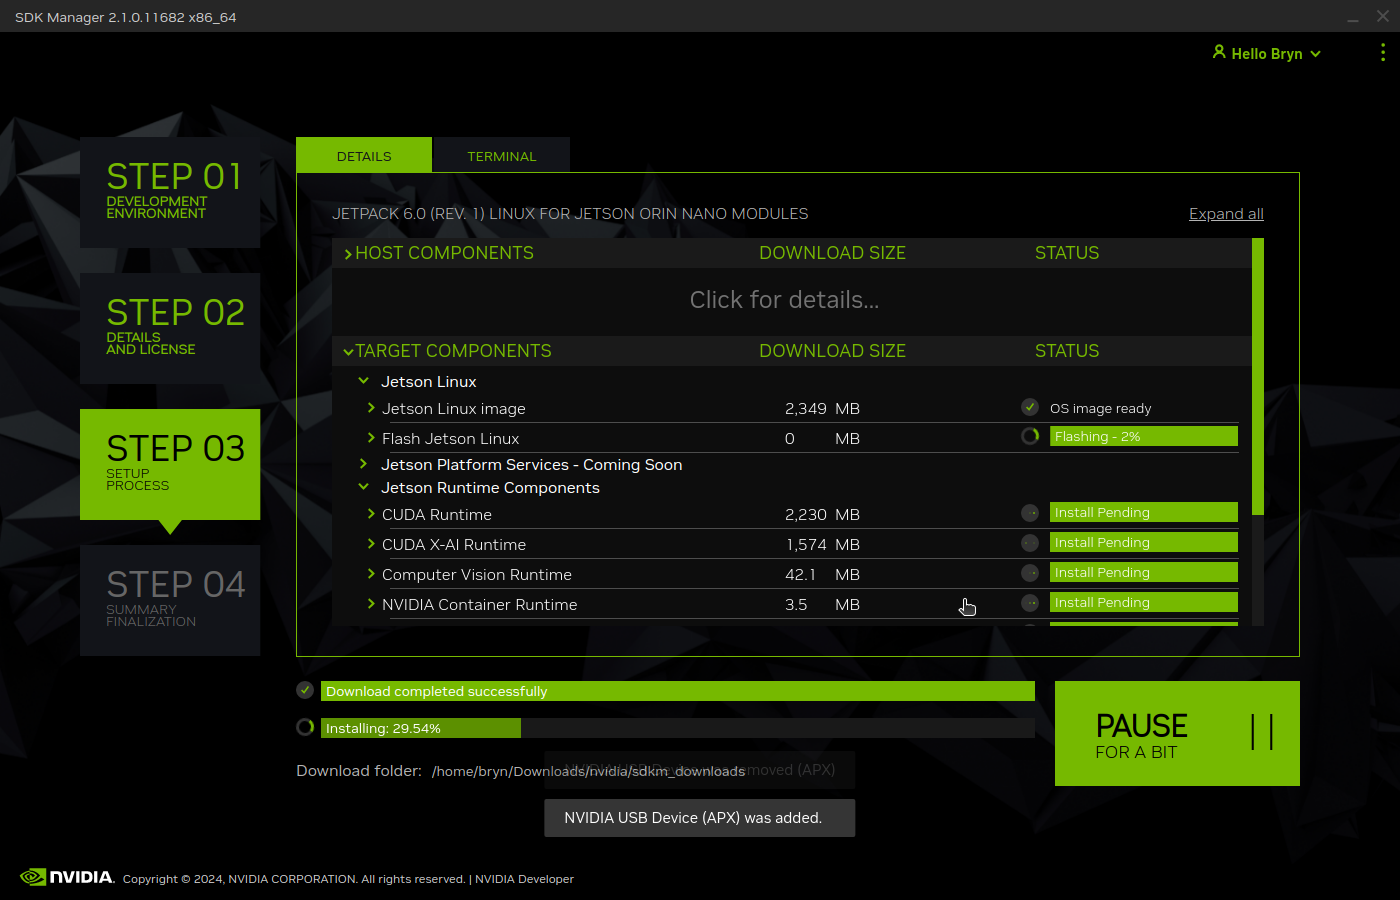
Getting CUDA and TensorRT working on the Nvidia Jetson Orin 8G took much longer than I expected, with many dead ends and device factory resets before the process was repeatable.
The testing consisted of permutations of three models TennisBallsYoloV8s20240618640×640.onnx, TennisBallsYoloV8s2024062410241024.onnx & TennisBallsYoloV8x20240614640×640 (limited testing as slow) and three images TennisBallsLandscape640x640.jpg, TennisBallsLandscape1024x1024.jpg & TennisBallsLandscape3072x4080.jpg.
Executive Summary
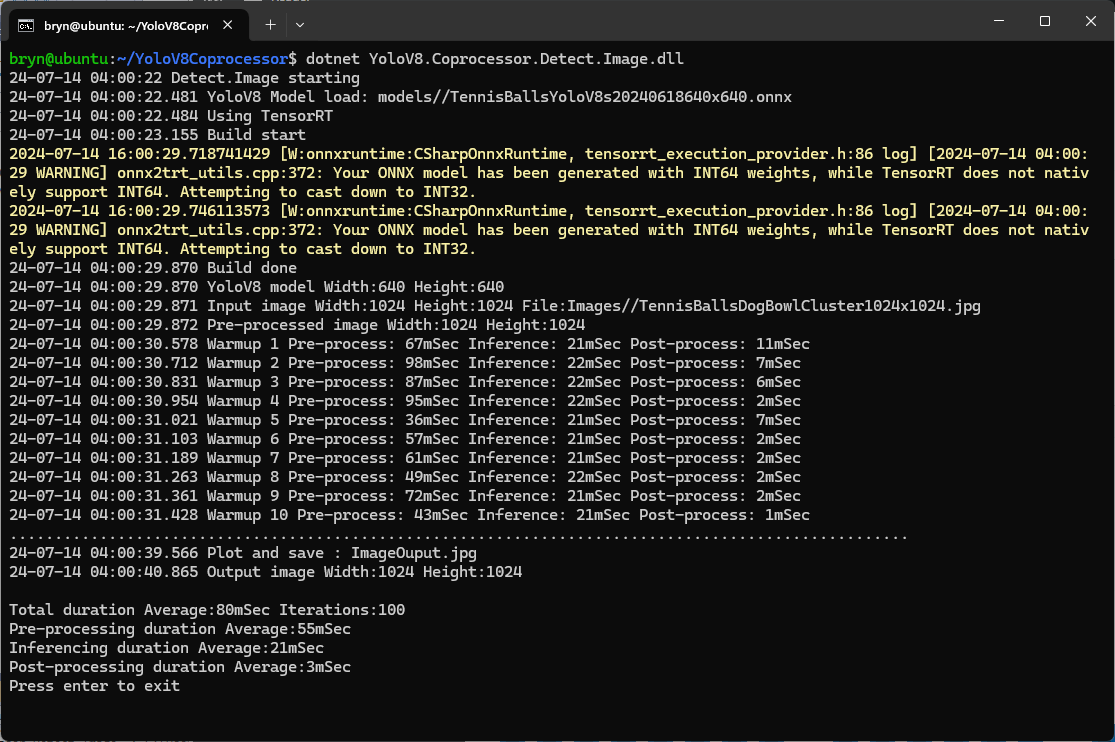
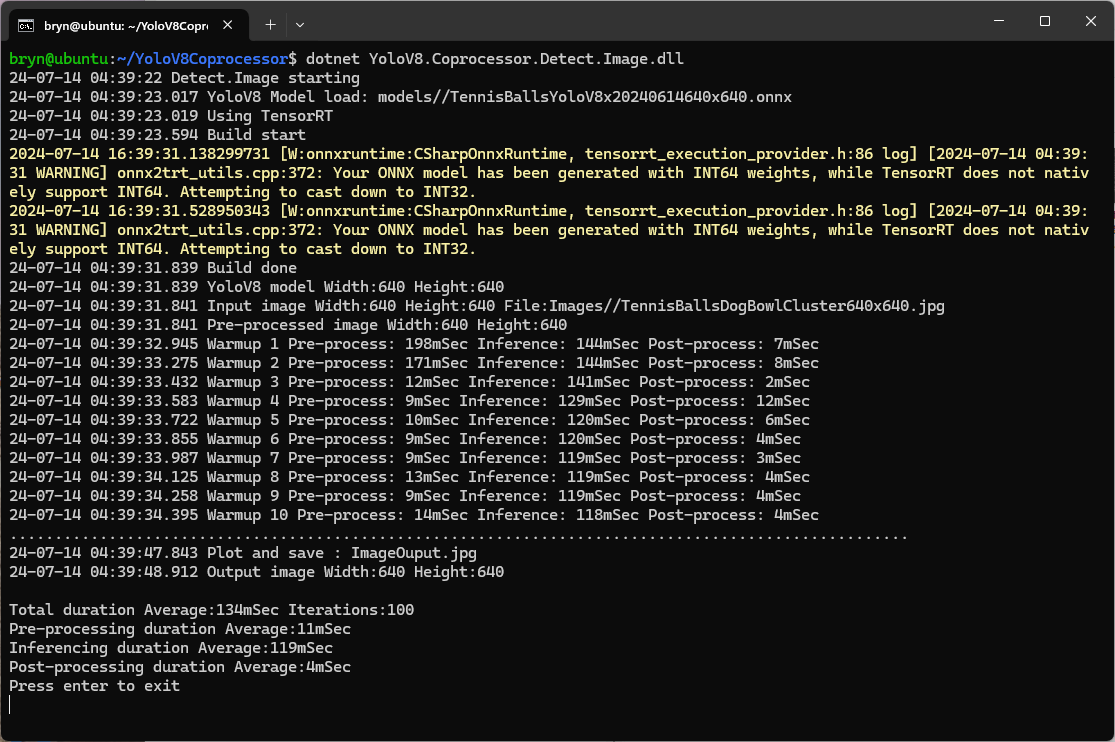
As expected, inferencing with a TensorRT 640×640 model and a 640×640 image was fastest, 9mSec pre-processing, 21mSec inferencing, then 4mSec post-processing.
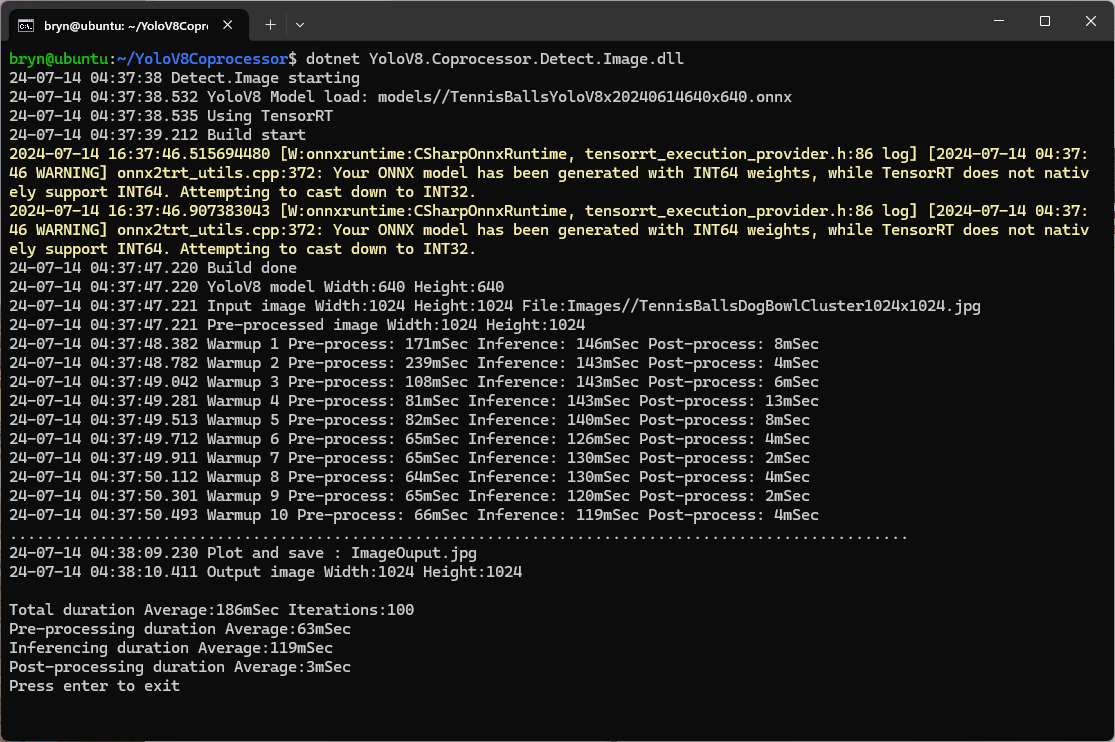
If the image had to be scaled with SixLabors.ImageSharp this significantly increased the preprocessing (and overall) time.
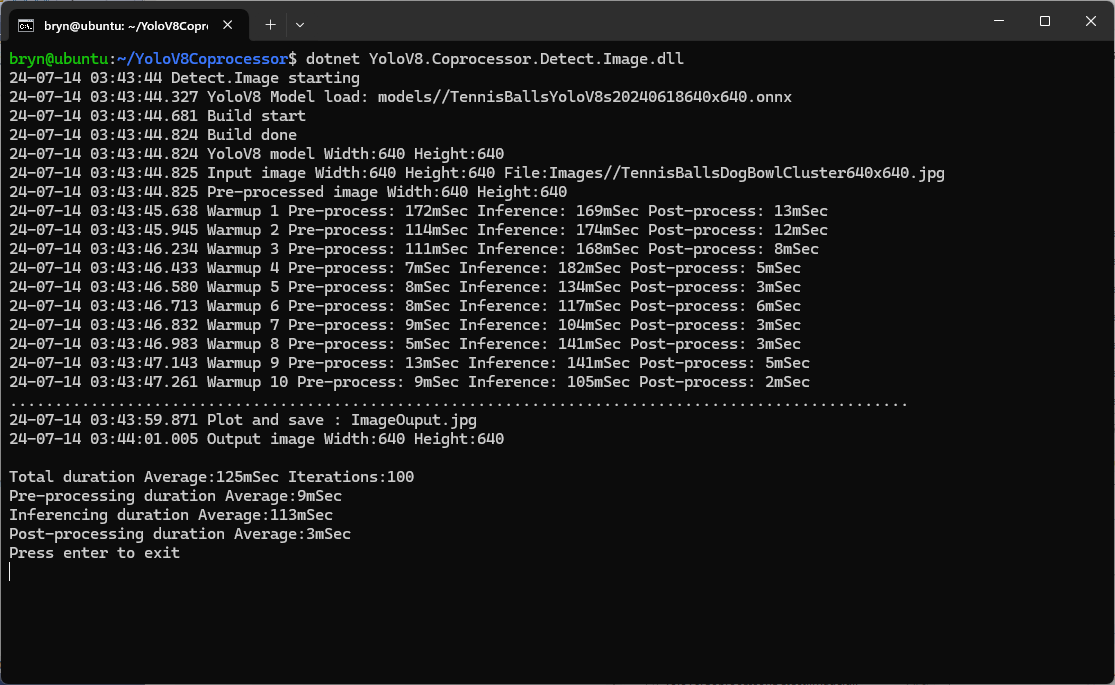
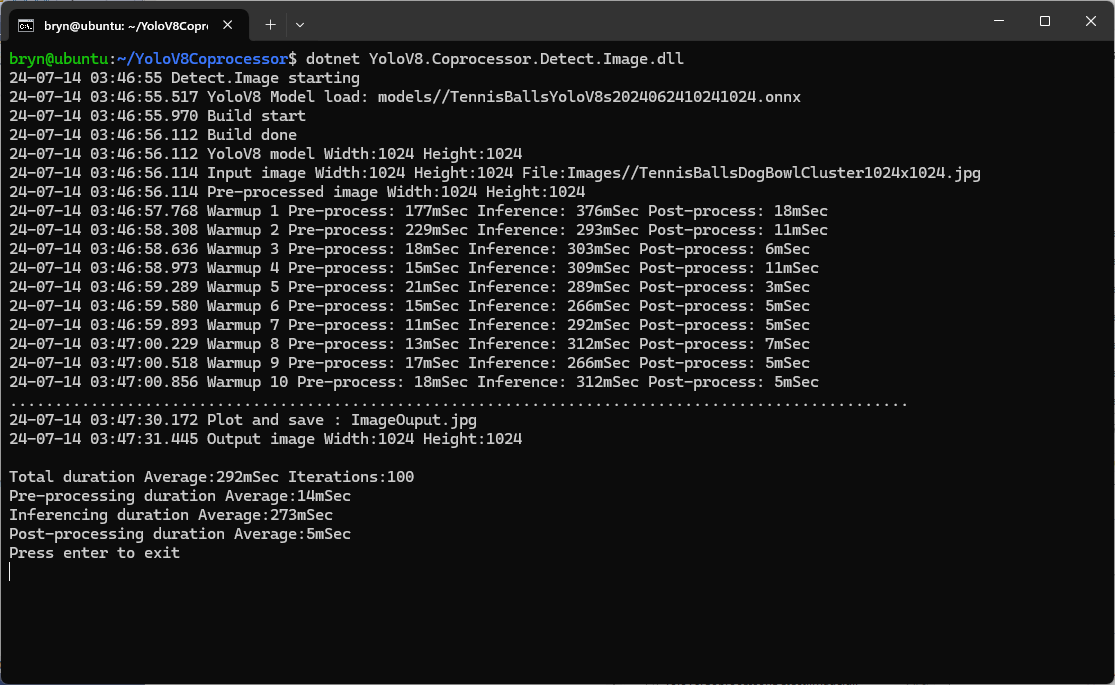
When running the YoloV8 Coprocessor demonstration on the Nividia Jetson Orin inferencing looked a bit odd, the dotted line wasn’t moving as fast as expected. To investigate this further I split the inferencing duration into pre-processing, inferencing and post-processing times. Inferencing and post-processing were “quick”, but pre-processing was taking longer than expected.
YoloV8 Coprocessor application running on Nvidia Jetson Orin
When I ran the demonstrationUltralytics YoloV8object detection console application on my development desktop (13th Gen Intel(R) Core(TM) i7-13700 2.10 GHz with 32.0 GB) the pre-processing was much faster.
The much shorter pre-processing and longer inferencing durations were not a surprise as my development desktop does not have a Graphics Processing Unit(GPU)
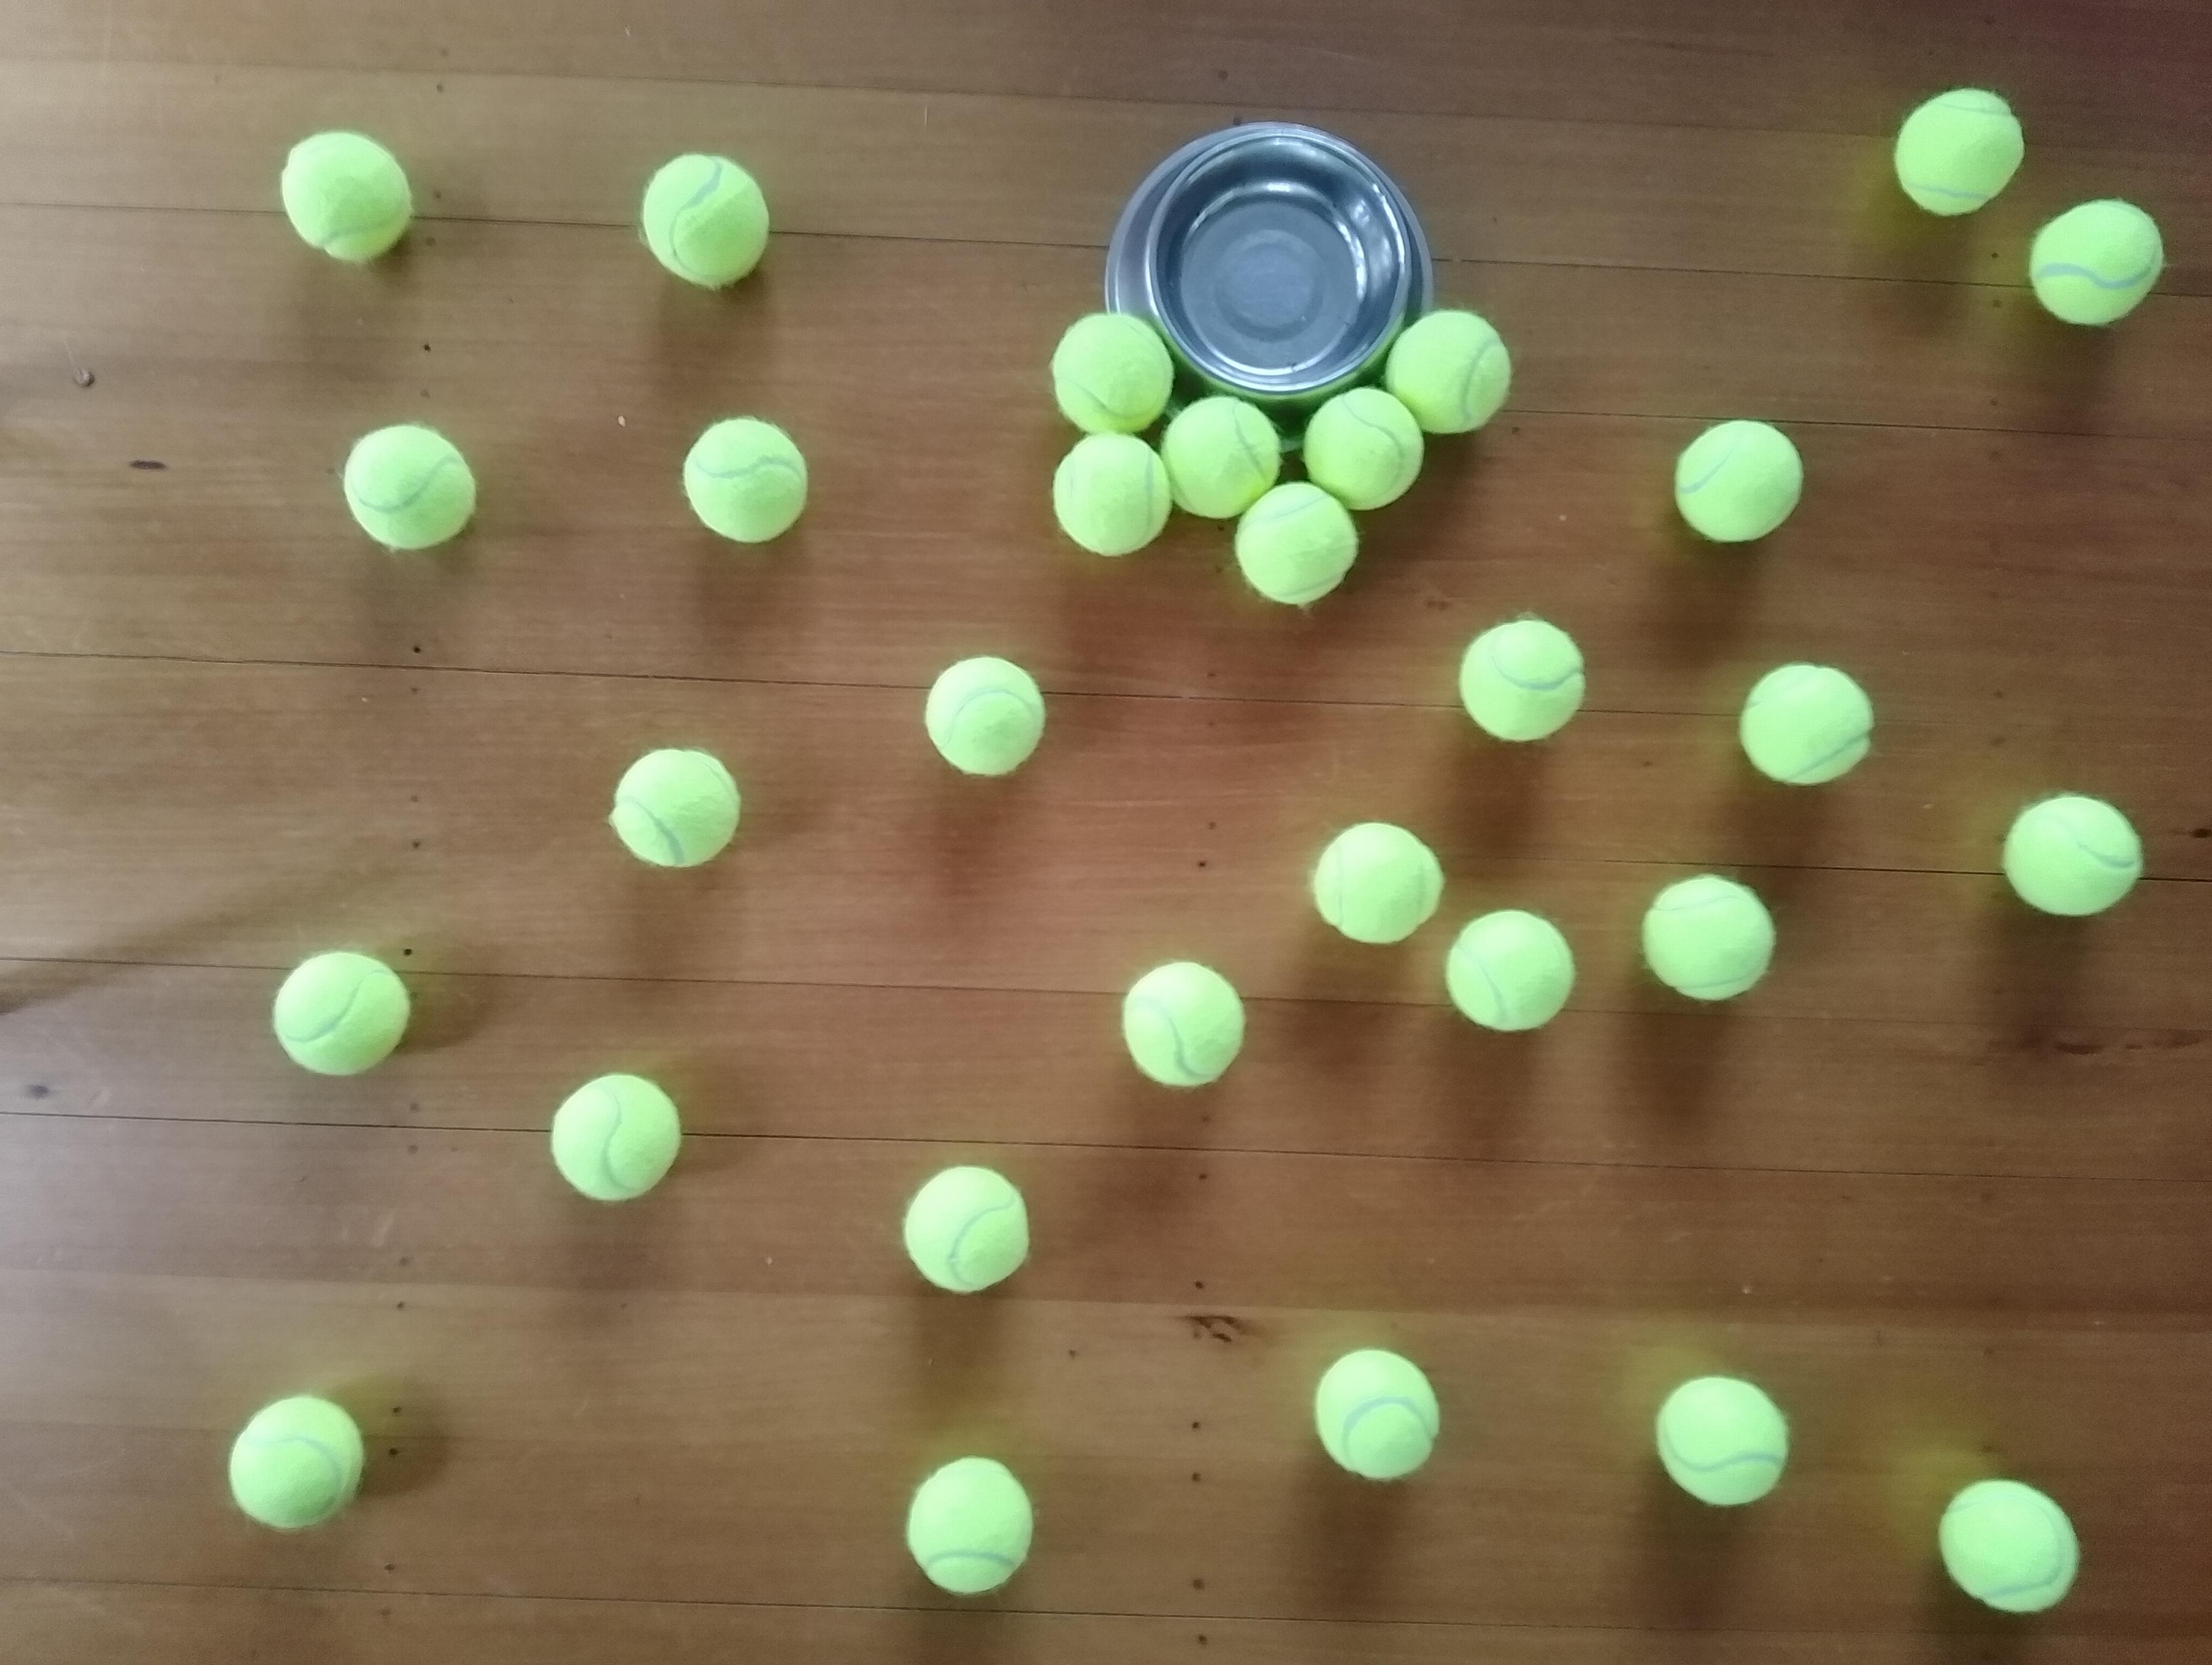
Test image used for testing on Jetson device and development PC
The test image taken with my mobile was 3606×2715 pixels which was representative of the security cameras images to be processed by the solution.
 public static void ProcessToTensor(Image<Rgb24> image, Size modelSize, bool originalAspectRatio, DenseTensor<float> target, int batch)
 {
    var options = new ResizeOptions()
    {
       Size = modelSize,
       Mode = originalAspectRatio ? ResizeMode.Max : ResizeMode.Stretch,
    };

    var xPadding = (modelSize.Width - image.Width) / 2;
    var yPadding = (modelSize.Height - image.Height) / 2;

    var width = image.Width;
    var height = image.Height;

    // Pre-calculate strides for performance
    var strideBatchR = target.Strides[0] * batch + target.Strides[1] * 0;
    var strideBatchG = target.Strides[0] * batch + target.Strides[1] * 1;
    var strideBatchB = target.Strides[0] * batch + target.Strides[1] * 2;
    var strideY = target.Strides[2];
    var strideX = target.Strides[3];

    // Get a span of the whole tensor for fast access
    var tensorSpan = target.Buffer;

    // Try get continuous memory block of the entire image data
    if (image.DangerousTryGetSinglePixelMemory(out var memory))
    {
       Parallel.For(0, width * height, index =>
       {
             int x = index % width;
             int y = index / width;
             int tensorIndex = strideBatchR + strideY * (y + yPadding) + strideX * (x + xPadding);

             var pixel = memory.Span[index];
             WritePixel(tensorSpan.Span, tensorIndex, pixel, strideBatchR, strideBatchG, strideBatchB);
       });
    }
    else
    {
       Parallel.For(0, height, y =>
       {
             var rowSpan = image.DangerousGetPixelRowMemory(y).Span;
             int tensorYIndex = strideBatchR + strideY * (y + yPadding);

             for (int x = 0; x < width; x++)
             {
                int tensorIndex = tensorYIndex + strideX * (x + xPadding);
                var pixel = rowSpan[x];
                WritePixel(tensorSpan.Span, tensorIndex, pixel, strideBatchR, strideBatchG, strideBatchB);
             }
       });
    }
 }

 private static void WritePixel(Span<float> tensorSpan, int tensorIndex, Rgb24 pixel, int strideBatchR, int strideBatchG, int strideBatchB)
 {
    tensorSpan[tensorIndex] = pixel.R / 255f;
    tensorSpan[tensorIndex + strideBatchG - strideBatchR] = pixel.G / 255f;
    tensorSpan[tensorIndex + strideBatchB - strideBatchR] = pixel.B / 255f;
 }
For a 3606×2715 image the WritePixel method would be called tens of millions of times so its implementation and the overall approach used for ProcessToTensor has a significant impact on performance.
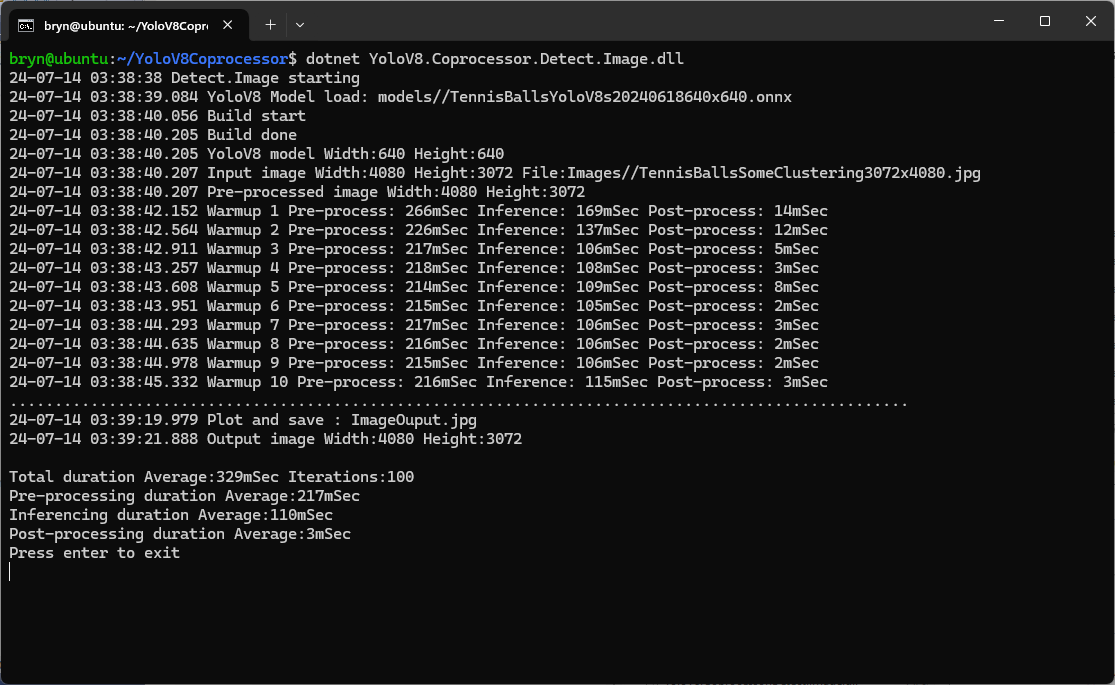
YoloV8 Coprocessor application running on Nvidia Jetson Orin with a resized image
Resizing the images had a significant impact on performance on the development box and Nividia Jetson Orin. This will need some investigation to see how much reducing the resizing the images impacts on the performance and accuracy of the model.
Generating the TensorRT engine every time the application is started
The TensorRT Execution provider has a number of configuration options but the IYoloV8Builder interface had to modified with UseCuda, UseRocm, UseTensorrt and UseTvm overloads implemented to allow additional configuration settings.
...
public class YoloV8Builder : IYoloV8Builder
{
...
    public IYoloV8Builder UseOnnxModel(BinarySelector model)
    {
        _model = model;

        return this;
    }

#if GPURELEASE
    public IYoloV8Builder UseCuda(int deviceId) => WithSessionOptions(SessionOptions.MakeSessionOptionWithCudaProvider(deviceId));

    public IYoloV8Builder UseCuda(OrtCUDAProviderOptions options) => WithSessionOptions(SessionOptions.MakeSessionOptionWithCudaProvider(options));

    public IYoloV8Builder UseRocm(int deviceId) => WithSessionOptions(SessionOptions.MakeSessionOptionWithRocmProvider(deviceId));

    // Couldn't test this don't have suitable hardware
    public IYoloV8Builder UseRocm(OrtROCMProviderOptions options) => WithSessionOptions(SessionOptions.MakeSessionOptionWithRocmProvider(options));

    public IYoloV8Builder UseTensorrt(int deviceId) => WithSessionOptions(SessionOptions.MakeSessionOptionWithTensorrtProvider(deviceId));

    public IYoloV8Builder UseTensorrt(OrtTensorRTProviderOptions options) => WithSessionOptions(SessionOptions.MakeSessionOptionWithTensorrtProvider(options));

    // Couldn't test this don't have suitable hardware
    public IYoloV8Builder UseTvm(string settings = "") => WithSessionOptions(SessionOptions.MakeSessionOptionWithTvmProvider(settings));
#endif
...
}
...
YoloV8Builder builder = new YoloV8Builder();

builder.UseOnnxModel(_applicationSettings.ModelPath);

if (_applicationSettings.UseTensorrt)
{
   Console.WriteLine($" {DateTime.UtcNow:yy-MM-dd HH:mm:ss.fff} Using TensorRT");

   OrtTensorRTProviderOptions tensorRToptions = new OrtTensorRTProviderOptions();

   Dictionary<string, string> optionKeyValuePairs = new Dictionary<string, string>();

   optionKeyValuePairs.Add("trt_engine_cache_enable", "1");
   optionKeyValuePairs.Add("trt_engine_cache_path", "enginecache/");

   tensorRToptions.UpdateOptions(optionKeyValuePairs);

   builder.UseTensorrt(tensorRToptions);
}
...
In order to validate that the loaded engine loaded from the trt_engine_cache_path is usable for the current inference, an engine profile is also cached and loaded along with engine
If current input shapes are in the range of the engine profile, the loaded engine can be safely used. If input shapes are out of range, the profile will be updated and the engine will be recreated based on the new profile.
Reusing the TensorRT engine built the first time the application is started
When the YoloV8.Coprocessor.Detect.Image application was configured to use NVIDIA TensorRT and the engine was cached the average inference time was 58mSec and the Build method took roughly 10sec to execute after the application had been run once.
I configured the demonstrationUltralytics YoloV8object detection(yolov8s.onnx) console application to process a 1920×1080 image from a security camera on my desktop development box (13th Gen Intel(R) Core(TM) i7-13700 2.10 GHz with 32.0 GB)
Object Detection sample application running on my development box
A Seeedstudio reComputerJ3011 uses a Nividia Jetson Orin 8G and looked like a cost-effective platform to explore how a dedicated Artificial Intelligence (AI) co-processor could reduce inferencing times.
To establish a “baseline” I “published” the demonstration application on my development box which created a folder with all the files required to run the application on the Seeedstudio reComputerJ3011 ARM64 CPU. I had to manually merge the “User Secrets” and appsettings.json files so the camera connection configuration was correct.
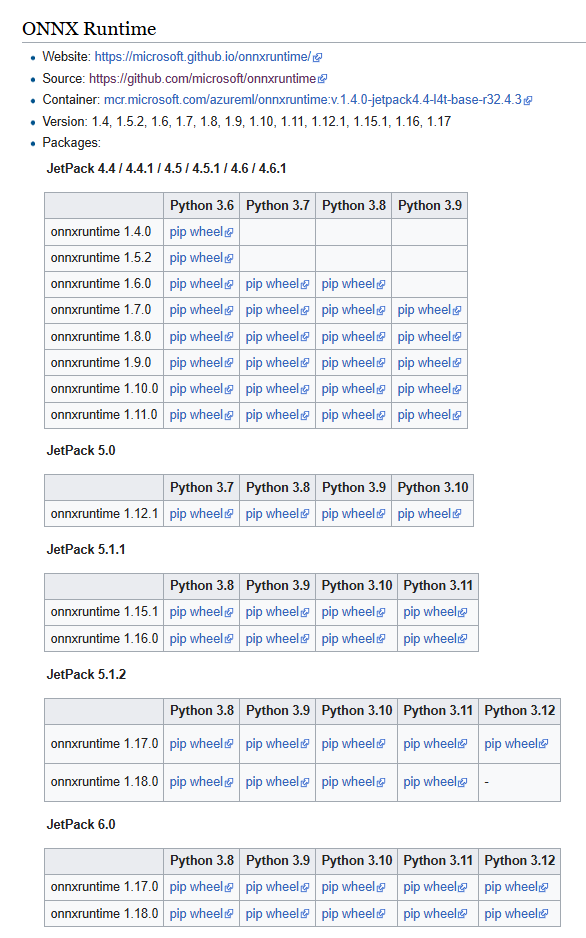
The runtimes folder contained a number of folders with the native runtime files for the supported Open Neural Network Exchange(ONNX) platforms
This Nividia Jetson Orin ARM64 CPU requires the linux-arm64 ONNX runtime which was “automagically” detected. (in previous versions of ML.Net the native runtime had to be copied to the execution directory)
Object Detection sample application running on my Seeedstudio reComputer J3011
When I averaged the pre-processing, inferencing and post-processing times for both devices over 20 executions my development box was much faster which was not a surprise. Though the reComputer J3011 post processing times were a bit faster than I was expecting
ARM64 CPU Preprocess 0.05s Inference 0.31s Postprocess 0.05